
Page 82 - Photodetection and Measurement - Maximizing Performance in Optical Systems
P. 82
Fundamental Noise Basics and Calculations
Fundamental Noise Basics and Calculations 75
-10
Clock
-20
frequency
Voltage (dBm) -30
-40
-50
-60
0.0 0.5 1.0 1.5 2.0 2.5
Frequency (MHz)
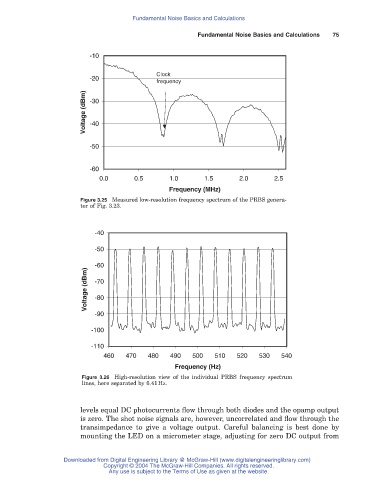
Figure 3.25 Measured low-resolution frequency spectrum of the PRBS genera-
tor of Fig. 3.23.
-40
-50
-60
Voltage (dBm) -70
-80
-90
-100
-110
460 470 480 490 500 510 520 530 540
Frequency (Hz)
Figure 3.26 High-resolution view of the individual PRBS frequency spectrum
lines, here separated by 6.41Hz.
levels equal DC photocurrents flow through both diodes and the opamp output
is zero. The shot noise signals are, however, uncorrelated and flow through the
transimpedance to give a voltage output. Careful balancing is best done by
mounting the LED on a micrometer stage, adjusting for zero DC output from
Downloaded from Digital Engineering Library @ McGraw-Hill (www.digitalengineeringlibrary.com)
Copyright © 2004 The McGraw-Hill Companies. All rights reserved.
Any use is subject to the Terms of Use as given at the website.