
Page 32 - Photoreactive Organic Thin Films
P. 32
PHOTOISOMERIZATION OF AZOBENZENES I
A review of these methods, with the mathematics of the kinetics, is given in a
technical report. 36
1.2.2.3 Solid Matrices: One or More Independent Photolsomerizations?
The kinetic analysis presented in Section 1.2.2.1 should result in a first
order of the reaction when all photoresponsive units are equivalent (uniform
reaction). This is generally the case in homogeneous solution, but it may be
different in solid matrices, especially if these consist of different molecular
components, and even more so if there is some kind of complexing of the
photoresponsive and a matrix molecule. Then there may be nonequivalent
sites that influence the absorption coefficient and/or the quantum yield of the
photoresponsive unit. This leads to deviations from the first order behavior.
Mauser developed a method for the mathematical analysis of the kinetics
37 38 39 40
of complex reaction systems, ' ' ' which can apply here because the reac-
tions at different sites are kinetically independent. As simple graphic instru-
ments, the Mauser diagrams are useful for determining how many kinetically
independent reactions (s) occur in the reaction system (the three elementary
reactions in Scheme I are not independent).
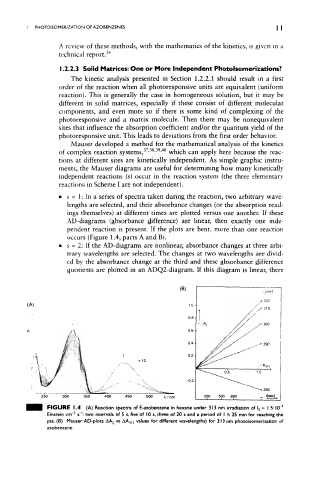
» s = 1: In a series of spectra taken during the reaction, two arbitrary wave-
lengths are selected, and their absorbance changes (or the absorption read-
ings themselves) at different times are plotted versus one another. If these
AD-diagrams (absorbance difference) are linear, then exactly one inde-
pendent reaction is present. If the plots are bent, more than one reaction
occurs (Figure 1.4, parts A and B).
• s = 2: If the AD-diagrams are nonlinear, absorbance changes at three arbi-
trary wavelengths are selected. The changes at two wavelengths are divid-
ed by the absorbance change at the third and these absorbance difference
quotients are plotted in an ADQ2-diagram. If this diagram is linear, there
(B)
(A)
0.8-
0.6-
0.4-
0.2
300 350 400 450 500 x/nm 200 500 800
FIGURE 1.4 (A) Reaction spectra of E-azobenzene in hexane under 313 nm irradiation of I 0 ~ 1.5-10"'
2
1
Einstein cm" s" : two intervals of 5 s, five of 10 s, three of 20 s and a period of I h 25 min for reaching the
pss. (B) Mauser AD-plots AA^ vs AA 3| 3 values for different wavelengths) for 313 nm photoisomerization of
azobenzene.