
Page 88 - Photoreactive Organic Thin Films
P. 88
3. PHOTO-ORIENTATION BY PHOTOISOMERIZATION £7
for each, the process of photoisomerization differs. For the photoisomeriz-
ation of azobenzenes, the free volume needed for inversion is lower than
what is needed for rotation.
Most photo-orientation studies in thin solid films have been
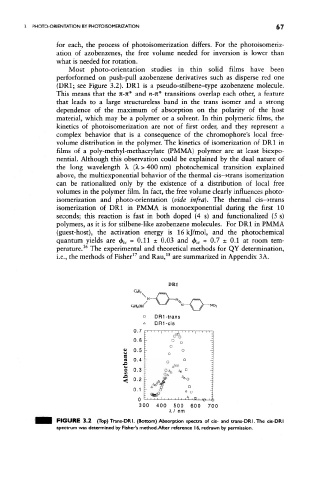
perforformed on push-pull azobenzene derivatives such as disperse red one
(DR1; see Figure 3.2). DR1 is a pseudo-stilbene-type azobenzene molecule.
This means that the n-n* and n-n* transitions overlap each other, a feature
that leads to a large structureless band in the trans isomer and a strong
dependence of the maximum of absorption on the polarity of the host
material, which may be a polymer or a solvent. In thin polymeric films, the
kinetics of photoisomerization are not of first order, and they represent a
complex behavior that is a consequence of the chromophore's local free-
volume distribution in the polymer. The kinetics of isomerization of DR1 in
films of a poly-methyl-methacrylate (PMMA) polymer are at least biexpo-
nential. Although this observation could be explained by the dual nature of
the long wavelength X (k > 400 nm) photochemical transition explained
above, the multiexponential behavior of the thermal cis—Hrans isomerization
can be rationalized only by the existence of a distribution of local free
volumes in the polymer film. In fact, the free volume clearly influences photo-
isomerization and photo-orientation (vide infra). The thermal cis-~>trans
isomerization of DR1 in PMMA is monoexponential during the first 10
seconds; this reaction is fast in both doped (4 s) and functionalized (5 s)
polymers, as it is for stilbene-like azobenzene molecules. For DR1 in PMMA
(guest-host), the activation energy is 16 kj/mol, and the photochemical
quantum yields are (f> tc = 0.11 ± 0.03 and <fr ct = 0.7 ± 0.1 at room tem-
16
perature. The experimental and theoretical methods for QY determination,
17
18
i.e., the methods of Fisher and Rau, are summarized in Appendix 3A.
o DR1 -trans
a DR1-cis
0.7 p-r^TT^-^T-o-rT-rT-r-r-r-r-m
0-6 b o ° 0 ~
F o :
0> 0.5 - o -
e - O -
es 0.4 — O —
ja o
t*
A
o 0.3 ~ o&. ^ 0 -
Js OA A& :
0.2 i. <£• o -
^ l
0.1 L ***£ ° -
0 L_Sj.., , , , 1 , ,*, ,CD . , 0, ,\
300 400 500 600 7C
K 1 nm
FIGURE 3.2 (Top) Trans-DRI. (Bottom) /y>sorption spectra of cis- and trans-DRl.The cis-DRI
spectrum was determined by Fisher's method.After reference 16, redrawn by permission.