
Page 212 - Physical chemistry understanding our chemical world
P. 212
ENERGETIC INTRODUCTION TO PHASE EQUILIBRIA 179
gaseous H 2 O coexist at equilibrium. Note that this equilibrium is dynamic, because
as liquid is converted to gas an equal amount of gas is also converted back to liquid.
However, the values of pressure and temperature at equilibrium
depend on each other; so, if we change the pressure, then the tem- A phase diagram is a
perature of equilibrium shifts accordingly (as discussed further in graph showing values
Section 5.2). If we plotted all the experimental values of pressure of applied pressure and
and temperature at which equilibrium exists, to see the way they temperature at which
affect the equilibrium changes, then we obtain a graph called a equilibrium exists.
phase diagram, which looks something like the schematic graph in
Figure 5.1.
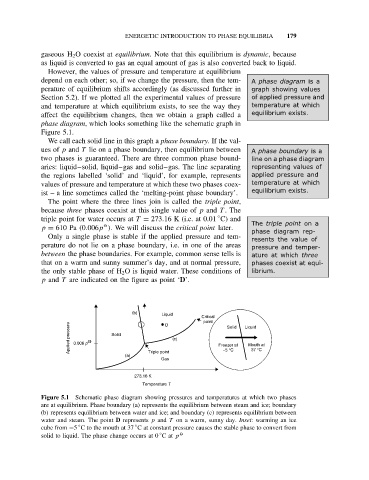
We call each solid line in this graph a phase boundary. If the val-
ues of p and T lie on a phase boundary, then equilibrium between A phase boundary is a
two phases is guaranteed. There are three common phase bound- line on a phase diagram
aries: liquid–solid, liquid–gas and solid–gas. The line separating representing values of
the regions labelled ‘solid’ and ‘liquid’, for example, represents applied pressure and
values of pressure and temperature at which these two phases coex- temperature at which
ist – a line sometimes called the ‘melting-point phase boundary’. equilibrium exists.
The point where the three lines join is called the triple point,
because three phases coexist at this single value of p and T .The
◦
triple point for water occurs at T = 273.16 K (i.e. at 0.01 C) and
The triple point on a
p = 610 Pa (0.006p ). We will discuss the critical point later.
O
phase diagram rep-
Only a single phase is stable if the applied pressure and tem-
resents the value of
perature do not lie on a phase boundary, i.e. in one of the areas pressure and temper-
between the phase boundaries. For example, common sense tells is ature at which three
that on a warm and sunny summer’s day, and at normal pressure, phases coexist at equi-
the only stable phase of H 2 O is liquid water. These conditions of librium.
p and T are indicated on the figure as point ‘D’.
(b) Liquid
Critical
point Solid Liquid
Applied pressure 0.006 p O Solid (c) Freezer at Mouth at
D
(a) Triple point −5 °C 37 °C
Gas
273.16 K
Temperature T
Figure 5.1 Schematic phase diagram showing pressures and temperatures at which two phases
are at equilibrium. Phase boundary (a) represents the equilibrium between steam and ice; boundary
(b) represents equilibrium between water and ice; and boundary (c) represents equilibrium between
water and steam. The point D represents p and T on a warm, sunny day. Inset: warming an ice
◦
◦
cube from −5 C to the mouth at 37 C at constant pressure causes the stable phase to convert from
◦
solid to liquid. The phase change occurs at 0 Cat p O