
Page 216 - Physical chemistry understanding our chemical world
P. 216
ENERGETIC INTRODUCTION TO PHASE EQUILIBRIA 183
Solid
(grey)
6
tin
p O
4
Solid Liquid tin
log(p/Pa) 0 tin
(white)
2
−2
−4
Tin vapour
−6
0 200 400 600 800 1000 1200
Temperature/°C
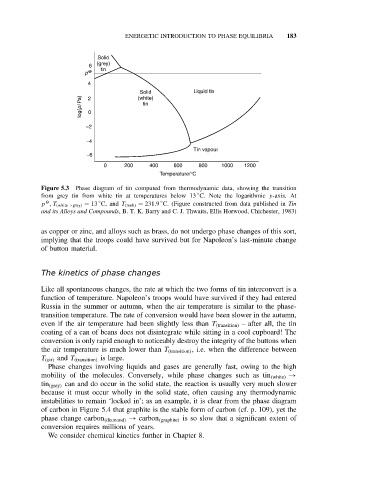
Figure 5.3 Phase diagram of tin computed from thermodynamic data, showing the transition
◦
from grey tin from white tin at temperatures below 13 C. Note the logarithmic y-axis. At
O
◦
◦
p ,T (white→grey) = 13 C, and T (melt) = 231.9 C. (Figure constructed from data published in Tin
and its Alloys and Compounds, B. T. K. Barry and C. J. Thwaits, Ellis Horwood, Chichester, 1983)
as copper or zinc, and alloys such as brass, do not undergo phase changes of this sort,
implying that the troops could have survived but for Napoleon’s last-minute change
of button material.
The kinetics of phase changes
Like all spontaneous changes, the rate at which the two forms of tin interconvert is a
function of temperature. Napoleon’s troops would have survived if they had entered
Russia in the summer or autumn, when the air temperature is similar to the phase-
transition temperature. The rate of conversion would have been slower in the autumn,
even if the air temperature had been slightly less than T (transition) – after all, the tin
coating of a can of beans does not disintegrate while sitting in a cool cupboard! The
conversion is only rapid enough to noticeably destroy the integrity of the buttons when
the air temperature is much lower than T (transition) , i.e. when the difference between
T (air) and T (transition) is large.
Phase changes involving liquids and gases are generally fast, owing to the high
mobility of the molecules. Conversely, while phase changes such as tin (white) →
tin (grey) can and do occur in the solid state, the reaction is usually very much slower
because it must occur wholly in the solid state, often causing any thermodynamic
instabilities to remain ‘locked in’; as an example, it is clear from the phase diagram
of carbon in Figure 5.4 that graphite is the stable form of carbon (cf. p. 109), yet the
phase change carbon (diamond) → carbon (graphite) is so slow that a significant extent of
conversion requires millions of years.
We consider chemical kinetics further in Chapter 8.