
Page 214 - Physical chemistry understanding our chemical world
P. 214
ENERGETIC INTRODUCTION TO PHASE EQUILIBRIA 181
Why does water placed in a freezer become ice?
Spontaneity of phase changes
It will be useful to concentrate on the diagram in Figure 5.2 when considering why
a ‘phase change’ occurs spontaneously. We recall from Chapter 4 that one of the
simplest tests of whether a thermodynamic event can occur is to ascertain whether
the value of G is negative (in which case the change is indeed spontaneous) or
positive (when the change is not spontaneous).
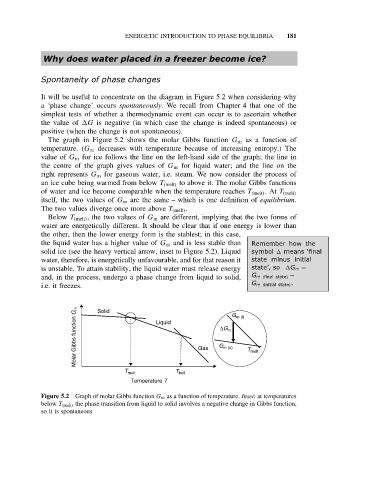
The graph in Figure 5.2 shows the molar Gibbs function G m as a function of
temperature. (G m decreases with temperature because of increasing entropy.) The
value of G m for ice follows the line on the left-hand side of the graph; the line in
the centre of the graph gives values of G m for liquid water; and the line on the
right represents G m for gaseous water, i.e. steam. We now consider the process of
an ice cube being warmed from below T (melt) to above it. The molar Gibbs functions
of water and ice become comparable when the temperature reaches T (melt) .At T (melt)
itself, the two values of G m are the same – which is one definition of equilibrium.
The two values diverge once more above T (melt) .
Below T (melt) , the two values of G m are different, implying that the two forms of
water are energetically different. It should be clear that if one energy is lower than
the other, then the lower energy form is the stablest; in this case,
the liquid water has a higher value of G m and is less stable than Remember how the
solid ice (see the heavy vertical arrow, inset to Figure 5.2). Liquid symbol means ‘final
water, therefore, is energetically unfavourable, and for that reason it state minus initial
is unstable. To attain stability, the liquid water must release energy state’, so G m =
and, in the process, undergo a phase change from liquid to solid, G m (final state) −
i.e. it freezes. Solid G m (initial state) .
Molar Gibbs function G m Liquid Gas G m (s) G m (l) T melt
∆G
m
T melt T boil
Temperature T
Figure 5.2 Graph of molar Gibbs function G m as a function of temperature. Inset: at temperatures
below T (melt) the phase transition from liquid to solid involves a negative change in Gibbs function,
so it is spontaneous