
Page 220 - Physical chemistry understanding our chemical world
P. 220
PRESSURE AND TEMPERATURE CHANGES WITH A SINGLE-COMPONENT SYSTEM 187
.01
.06 .05 .04 .03 .02
.08
°C °F
.1
400
°C °F
.2
700 700
.3
1200 .4
.6
600
1100 .8
600 .10
300 1000
2
500
900 3
4
500 6
800 8
400 10
700
20
400 30
200 600 40
300
60
500 80
100
300 200 400 200
300
300
500
100 700
100 200
200
100
0
Boiling point
Observed corrected to Pressure
boiling point 760 mmHg p/mmHg
(a) (b) (c)
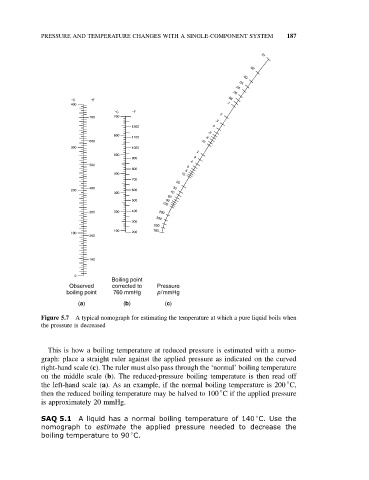
Figure 5.7 A typical nomograph for estimating the temperature at which a pure liquid boils when
the pressure is decreased
This is how a boiling temperature at reduced pressure is estimated with a nomo-
graph: place a straight ruler against the applied pressure as indicated on the curved
right-hand scale (c). The ruler must also pass through the ‘normal’ boiling temperature
on the middle scale (b). The reduced-pressure boiling temperature is then read off
◦
the left-hand scale (a). As an example, if the normal boiling temperature is 200 C,
◦
then the reduced boiling temperature may be halved to 100 C if the applied pressure
is approximately 20 mmHg.
◦
SAQ 5.1 A liquid has a normal boiling temperature of 140 C. Use the
nomograph to estimate the applied pressure needed to decrease the
boiling temperature to 90 C.
◦