
Page 247 - Physical chemistry understanding our chemical world
P. 247
214 PHASE EQUILIBRIA
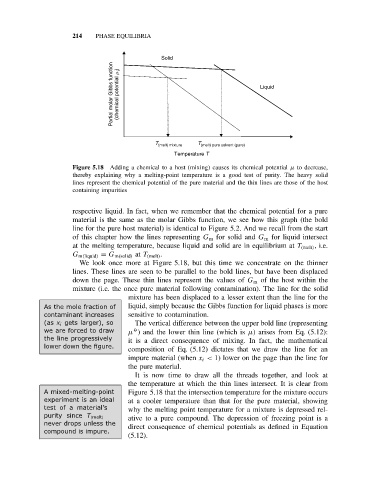
Solid
Partial molar Gibbs function (chemical potential m i ) Liquid
T (melt) mixture T (melt) pure solvent (pure)
Temperature T
Figure 5.18 Adding a chemical to a host (mixing) causes its chemical potential µ to decrease,
thereby explaining why a melting-point temperature is a good test of purity. The heavy solid
lines represent the chemical potential of the pure material and the thin lines are those of the host
containing impurities
respective liquid. In fact, when we remember that the chemical potential for a pure
material is the same as the molar Gibbs function, we see how this graph (the bold
line for the pure host material) is identical to Figure 5.2. And we recall from the start
of this chapter how the lines representing G m for solid and G m for liquid intersect
at the melting temperature, because liquid and solid are in equilibrium at T (melt) , i.e.
G m(liquid) = G m(solid) at T (melt) .
We look once more at Figure 5.18, but this time we concentrate on the thinner
lines. These lines are seen to be parallel to the bold lines, but have been displaced
down the page. These thin lines represent the values of G m of the host within the
mixture (i.e. the once pure material following contamination). The line for the solid
mixture has been displaced to a lesser extent than the line for the
As themolefraction of liquid, simply because the Gibbs function for liquid phases is more
contaminant increases sensitive to contamination.
(as x i gets larger), so The vertical difference between the upper bold line (representing
we are forced to draw µ ) and the lower thin line (which is µ) arises from Eq. (5.12):
O
the line progressively it is a direct consequence of mixing. In fact, the mathematical
lower down the figure.
composition of Eq. (5.12) dictates that we draw the line for an
impure material (when x i < 1) lower on the page than the line for
the pure material.
It is now time to draw all the threads together, and look at
the temperature at which the thin lines intersect. It is clear from
A mixed-melting-point Figure 5.18 that the intersection temperature for the mixture occurs
experiment is an ideal at a cooler temperature than that for the pure material, showing
test of a material’s why the melting point temperature for a mixture is depressed rel-
purity since T (melt) ative to a pure compound. The depression of freezing point is a
never drops unless the
direct consequence of chemical potentials as defined in Equation
compound is impure.
(5.12).