Page 310 - Pipeline Risk Management Manual Ideas, Techniques, and Resources
P. 310
Comparing pipelines and station  13/287
               as shown in Table 13. 15. From this table, a costibenefit ratio is   be for reasons  of project prioritization  or to assist in design
               easily calculated. This ratio is used to help prioritize mainte-   decisions such as pipeline loops versus more pump stations.
               nance and capital expenditures for the next period.   The pipeline relative risk scores represent the relative level
                 AST Inc. utilizes all of their lower cost (high costmenefit   of risk that  each point along the pipeline presents to its sur-
               ratio) options first. They do this with the confidence that their   roundings. The scores are usually insensitive to length. If two
               process is automatically compensating for risk reduction bene-   pipeline segments, 100 and2600 A, respectively, have the same
               fits-that  is, because all risk points are of the same magnitude,   risk score, then each point along the  100-ft segment presents
               it makes  sense  to  first  exhaust  the low-cost  alternatives  to   the same risk as does each point along the 26004 length. Of
               improve risk. Then,  the more  expensive alternatives  can be   course, the 2600-ft length presents more overall risk than does
               explored if risks are still seen as being unacceptable. This yields   the  100-ft length because  it has  many  more  risk-producing
               the greatest amount ofbenefits because resources are most effi-   points. A cumulative risk calculation as described in Chapter 14
               ciently utilized.                          adds the length aspect to a risk score so that a 1 00-ft length of
                 AST Inc. decides to focus improvement efforts on Tank 655   pipeline with one risk score can be compared against a 2600-ft
               first, given the higher risks (higher consequences) seen there.   length with a different risk score.
               They  further  decide  to  budget  additional  resources  toward   A direct and intuitive way to make comparisons with station
               improved secondary containment only for Tank 655. This par-   facilities  is to recognize  that, just  as with  the  pipeline  risk
               tially offsets the  higher receptor  risk in that  area. The  other   scores, each point within the station (or station section, if sev-
               tanks, having lower risks, will have their secondary contain-   eral portions of a station are scored separately) presents a cer-
               ment improvements prioritized  among all alternative uses of   tain  risk  to  its  surroundings.  To  quantify  the  total  risk
               resources. The  projected  impact  on  risk  is  demonstrated  in   introduced by  the station, we can use the station’s length and
               Table 13.16.                               width summed together, just as we use the pipeline segment’s
                 Note from Table 13.16 that AST Inc. controls both the risk   length to get a cumulative risk score for the pipeline. So, a sta-
               level and the rate of change in this risk management process.   tion that is 50 ft wide by 100 ft long has a risk score that applies
               They  decide  whether  to  systematically  and  slowly improve   to  150 ft. It  has  the  same  cumulative  risk  as a  150-ft-long
               their entire tank population  or rather  to target identified hot   pipeline with the same risk score, or as a pipeline segment that
               spots  for  immediate  improvements.  (Note that  the  numbers   is 300 ft long with half the risk score, and so forth. With this
               used in this example merely provide the reader with a sense of   simple approach, all station scores can be compared to pipeline
               the methodology; they are not necessarily in correct propor-   segments using the cumulative risk relationship. Alternatively,
               tion, mathematically correct. or representative of actual data.)   the risk evaluator may choose to use a perimeter or 2 times the
                                                          width + length as a better basis for comparison with pipeline
                                                          ROW  lengths. Where  available, failure rates  in  stations  and
               X.  Comparing pipelines and stations       pipeline ROW respectively can be used to help establish a size-
                                                          equivalency relationship.
               Operators often want to compare pipeline segments with sta-   This approach is consistent with the use ofrelease volume cal-
               tions or parts of stations-facilities  within stations. This might   culations and implied hazard zones for releases. A station with

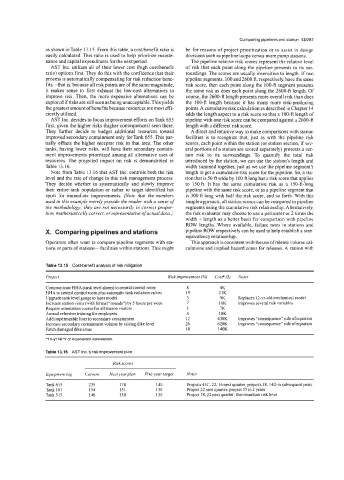
               Table 13.15  Cost-benefit analysis of risk mitigation
               Project                              Risk improvement (%)   Cos?  ($)   Notes

               Communicate HHA (tank level alarm) to central control room   8   4K
               HHA to central control room plus automatic tank isolation valves   19   21K
               Upgrade tank level gauge to laser model    3         9K    Replaces 12-yr-old mechanical model
               Increase station visits (with formal “rounds”) by 5 hours per week   I   16K   Improves several risk variables
               Require orientation course for all station visitors   3   7K
               Annual refresher training for employees    4         18K
               Add impermeable liner to secondary containment   12   430K   Improves “consequence” side of equation
               Increase secondary containment volume by raising dike level   26   620K   Improves “consequence” side of equation
               Patch damaged dike areas                   18        140K
               alu-yr NPV or equivalent calculation.

               Table 13.16  AST Inc.’s risk improvement plan
                                    Risk scores
               Equipmerit tag   Current   Next yearplan   Five-year target   Notes
               Tank 655     235       178        140      Projects 43C, 22, 16 next quarter; projects 18,14D in subsequent years
               Tank 101     I54       151        130      Project 22 next quarter; project 15 in 2 years
               Tank 3 15    146       130        130      Project 18, 22 next quarter; then maintain risk level

