
Page 373 - Pipeline Risk Management Manual Ideas, Techniques, and Resources
P. 373
15/348 Risk Management
year) that balances the rate of deterioration could be calculated. For a minimum cost, they increase ground patrol (mostly
If this number can be calculated with relatively high confi- while technicians are already performing other duties) to
dence. it can be used to establish portions ofthe budgets. gain 2 risk reduction points (reduce the risk of third-party
An example of the practical application of risk management damage).
follows. For a cost of $8,000 they choose to do a close interval survey
to increase the corrosion index (reduce the corrosion risk)
Example 15.1: Cost/Riskanalysis by 8 points.
Finally, witnessing the testing of safety valves and critical
Note: The information contained in this example is a hypotheti- switches that impact their pipeline system yields another
cal situation created only to illustrate the reasoning process. risk reduction point (reducing the threat of incorrect operu-
One should not assume that the hypothetical decisions shown tions) for virtually no additional operating costs.
here are appropriate for a specific real-world situation. The four activity changes add 9 points of risk reduction to the
XYZ Pipeline Company determined that their LPG pipelines
running through high-population areas score an average of risk score for virtually no increase in operating costs. This off-
sets the 5 points natural decay (increase in risk) and nets a
210 points on their 400-point risk scale. XYZ has been track- safety increase of (9 - 5)/210 = 2%, based on the assumptions
ing incident rate (not necessarily reportable accidents as in this methodology. Note that the four activities impacted three
defined by DOT) for several years. XYZ’s incident frequency indexes: the third-party damage, design, and corrosion indexes.
for the last 10 years has been 0.0012 per mile per year, or A quick check confirms that the new risk level in each index is
about an incident per year for every 1000 miles of pipeline. still in an acceptable range.
Therefore, a risk score of 210 points equates to an incident fre-
quency of 0.0012/mile/year for these pipelines, assuming that See also Chapter 13 for more examples ofrisk management for
the incident rate fairly represents the portions of the system in distribution systems.
high-population areas.
In the present economic climate, XYZ decides that it cannot
increase its spending toward risk reduction. The present risk XI. Program administration
score and, hence, the present incident frequency, is therefore
deemed to be the risk target. Even though next year’s score will To ensure proper use and ongoing utility of the risk rnanage-
be lower due to aging effects, additional spending is prohibited. ment program (RMP), control documents and administrative
With the exception of normal salary increases and the rare rene- processes should be established. The processes must, of course,
gotiated contract for services, costs are to remain fixed in the be under the control of an individual or group. This section dis-
coming time period. cusses issues related to how a pipeline company can effectively
The challenge to the pipeline operator is to either maintain or administer a RMP.
reduce the current risk level at present costs. As already noted,
the current risk level is slowly, but constantly increasing. Points Organization
have been lost due to the length of time since the last integrity
verification and the last close-interval survey and the condition If formal pipeline risk management is new to a pipeline com-
of the right-of-way . So even if the operator performs exactly pany, a decision regarding the part of the organization that will
the same activities as last year, the risk level will have worsened be responsible for the program must be made.
by 5 points. The operating team must choose the highest value Experience shows that strong support is often required for
activities and perhaps reduce or eliminate some lower any new effort to take root in an organization, especially when
value activities. They created Table 15.7 to help make these the effort involves changes to how work processes have histori-
choices (note that higher point scores mean less risk). cally been accomplished. Even though the RMP is mostly a for-
From such a table, the team derives the cost and risk impact of malization of current practices and knowledge, it involves
various activity choices. They choose four ofthese options: enough new processes and disciplines that some resistance may
be encountered. This is especially true when manpower is lim-
1. Changing the public education program from a door-to-door ited and new programs are seen as merely adding to the existing
visit every year to a visit every other year saves $8000 annu- workload.
ally. However, this slightly increases third-party damage Because a full RMP touches on many different parts of a
risk by 2 points. This is seen to be an acceptable trade-off. pipeline organization, strong leadership and coordination may
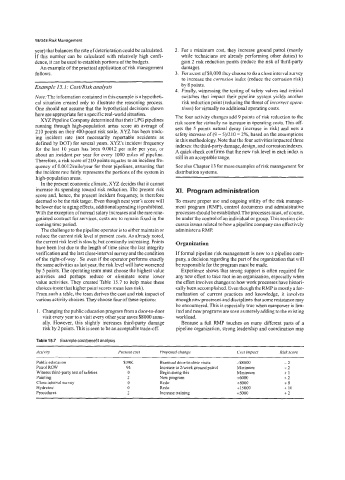
Table 15.7 Example cosvbenefit analysis
Activiry Present cost Proposed change cost impact Riskscore
Public education $39K Biannual door-to-door visits -$SO00 -2
Patrol ROW 94 increase to 2lweek ground patrol Minimum +2
Witness third-party test ofsafeties 0 Begin doing this Minimum +1
Painting 2 New program +6000 +2
Close interval survey 0 Redo +so00 +S
Hydrotest 0 Redo +1sooo + 10
Procedures 2 Increase training +so00 +2