
Page 370 - Pipeline Risk Management Manual Ideas, Techniques, and Resources
P. 370
costs 15/345
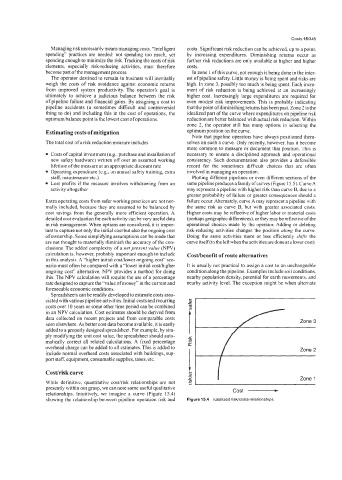
Managing risk necessarily means managing costs. “Intelligent costs. Significant risk reduction can be achieved up to a point,
spending” practices are needed: not spending too much, yet by increasing expenditures. Diminishing returns occur as
spending enough to minimize the risk. Tracking the costs of risk further risk reductions are only available at higher and higher
elements, especially risk-reducing activities, must therefore costs.
become part of the management process. In zone I of this curve, not enough is being done in the inter-
The operator destined to remain in business will inevitably est of pipeline safety. Little money is being spent and risks are
weigh the costs of risk avoidance against economic returns high. In zone 3, possibly too much is being spent. Each incre-
from improved system productivity. The operator’s goal is ment of risk reduction is being achieved at an increasingly
ultimately to achieve a judicious balance between the risk higher cost. Increasingly large expenditures are required for
of pipeline failure and financial gains. By assigning a cost to even modest risk improvements. This is probably indicating
pipeline accidents (a sometimes difficult and controversial that the point of diminishing returns has been past. Zone 2 is the
thing to do) and including this in the cost of operations, the idealized part of the curve where expenditures on pipeline risk
optimum balance point is the lowest cost of operations. reduction are better balanced with actual risk reduction. Within
zone 2, the operator still has many options in selecting the
Estimating costs of mitigation optimumposition on the curve.
Note that pipeline operators have always positioned them-
The total cost of a risk reduction measure includes selves on such a curve. Only recently, however, has it become
more common to measure or document that position. This is
Costs of capital investment (e.g.. purchase and installation of necessary to ensure a disciplined approach and operational
new safety hardware) written off over an assumed working consistency. Such documentation also provides a defensible
lifetime of the measure at an appropriate discount rate record for the sometimes difficult choices that are often
Operating expenditure (e.g., on annual safety training, extra involved in managing an operation.
staff, maintenance etc.) Plotting different pipelines or even different sections of the
Lost profits if the measure involves withdrawing from an same pipeline produces a family of curves (Figure 15.5). Curve A
activity altogether may represent a pipeline with higher risk than curve B, due to a
greater probability of failure or greater consequences should a
Extra operating costs from safer working practices are not nor- failure occur. Alternately, curve A may represent a pipeline with
mally included, because they are assumed to be balanced by the same risk as curve B, but with greater associated costs.
cost savings from the generally more efficient operation. A Higher costs may be reflective of higher labor or material costs
detailed cost evaluation for each activity can be very useful data (perhaps geographic differences), or they may be reflective of the
in risk management. When options are considered, it is impor- operational choices made by the operator. Adding or deleting
tant to capture not only the initial cost but also the ongoing cost risk-reducing activities changes the position along the curve.
of ownership. Some simplifying assumptions can be made that Doing the same activities more or less efficiently sh$s the
are not thought to materially diminish the accuracy of the con- curve itself (to the lei? when the activities are done at a lower cost).
clusions. The added complexity of a netpresent value (NPV)
calculation is, however, probably important enough to include Costlbenefit of route alternatives
in this analysis. A “higher initial cost/lower ongoing cost” sce-
nario must often be compared with a “lower initial codhigher It is usually not practical to assign a cost to an unchangeable
ongoing cost” alternative. NPV provides a method for doing condition along the pipeline. Examples include soil conditions,
this. The NPV calculation will require the use of a percentage nearby population density, potential for earth movements. and
rate designed to capture the “value of money” in the current and nearby activity level. The exception might be when alternate
foreseeable economic conditions.
Spreadsheets can be readdy developed to estimate costs asso-
ciated with various pipeline activities. Initial costs and recurring
costs over 10 years or some other time period can be combined
in an NPV calculation. Cost estimates should be derived from 7
data collected on recent projects and from comparable costs
seen elsewhere. As better cost data become available, it is easily Zone 3
added to a properly designed spreadsheet. For example, by sim-
ply modifying the unit cost value, the spreadsheet should auto-
matically correct all related calculations. A fixed percentage
overhead charge can be added to all estimates. This is added to Zone 2
include normal overhead costs associated with buildings, sup-
port staff, equipment, consumable supplies, taxes, etc.
Cost/risk curve
Zone 1
While definitive, quantitative cosdrisk relationships are not cost -
presently within our grasp, we can note some useful qualitative
relationships. Intuitively, we imagine a curve (Figure 15.4)
showing the relationship between pipeline operation risk and Figure 15.4 Idealized risklcosts relationships.