
Page 366 - Pipeline Risk Management Manual Ideas, Techniques, and Resources
P. 366
Decision points 15/341
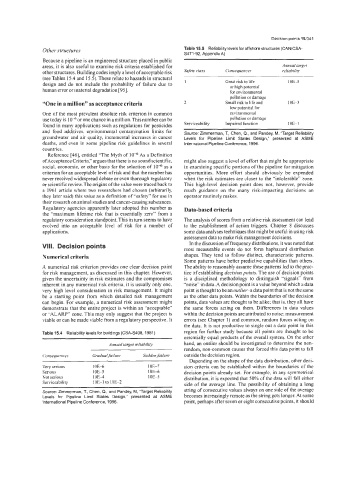
Other structures Table 15.5 Reliability levelsfor offshore structures (CANCSA-
S471-92, Appendix A)
Because a pipeline is an engineered structure placed in public
areas, it is also useful to examine risk criteria established for Annual target
other structures. Building codes imply a level of acceptable risk Safer?, class Consequence7 reliahdrh
(see Tables 15.4 and 15.5). These relate to hazards in structural
design and do not include the probability of failure due to 1 Great risk to life 1 OE -5
or high potential
human error or material degradation [95]. for environmental
pollution or damage
“One in a million” as acceptance criteria 2 Small risk to life and 1 OE-3
low potential for
One of the most prevalent absolute risk criterion in common environmental
use today is or one chance in a million. This number can be pollution or damage
found in many applications such as regulations for pesticides Serviceability Impaired function lOE-l
and food additives, environmental contamination limits for Source: Zimmerman, T, Chen, Q., and Pandey, M. “Target Reliability
groundwater and air quality, incremental increases in cancer Levels for Pipeline Limit States Design,” presented at ASME
deaths, and even in some pipeline risk guidelines in several International Pipeline Conference, 1996.
countries.
Reference [46], entitled “The Myth of As a Definition
ofAcceptance Criteria,” argues that there is no sound scientific, might also suggest a level of effort that might be appropriate
social, economic, or other basis for the selection of as a in examining specific portions of the pipeline for mitigation
criterion for an acceptable level of risk and that the number has opportunities. More effort should obviously be expended
never received widespread debate or even thorough regulatory when the risk estimates are closer to the “intolerable” zone.
or scientific review. The origins ofthe value were traced back to This high-level decision point does not, however, provide
a 1961 article where two researchers had chosen (arbitrarily, much guidance on the many risk-impacting decisions an
they later said) this value as a definition of “safety” for use in operator routinely makes.
their research on animal studies and cancer-causing substances.
Regulatory agencies apparently later adopted this number as Data-based criteria
the “maximum lifetime risk that is essentially zero” from a
regulatory consideration standpoint. This in turn seems to have The analysis of scores from a relative risk assessment can lead
evolved into an acceptable level of risk for a number of to the establishment of action triggers. Chapter 8 discusses
applications. some data analyses techniques that might be useful in using risk
assessment data to make risk management decisions.
In the discussion of frequency distributions, it was noted that
VIII. Decision points most measurable events do not form haphazard distribution
Numerical criteria shapes. They tend to follow distinct, characteristic patterns.
Some patterns have better predictive capabilities than others.
A numerical risk criterion provides one clear decision point The ability to reasonably assume these patterns led to the prac-
for risk management, as discussed in this chapter. However, tice of establishing decision points. The use of decision points
given the uncertainty in risk estimates and the compromises is a disciplined methodology to distinguish “signals” from
inherent in any numerical risk criteria, it is usually only one, “noise” in data. A decision point is a value beyond which a data
very high level consideration in risk management. It might point is thought to be an outlier-a data point that is not the same
be a starting point from which detailed risk management as the other data points. Within the boundaries of the decision
can begin. For example, a numerical risk assessment might points, data values are thought to be alike; that is, they all have
demonstrate that the entire project is within an “acceptable” the same forces acting on them. Differences in data values
or “ALARY’ zone. This may only suggest that the project is within the decision points are attributed to noise: measurement
viable or can be made viable from a regulatory perspective. It errors (see Chapter 1) and common, random forces acting on
the data. It is not productive to single out a data point in this
Table 15.4 Reliability levels for buildings (CSA-S408, 1981) region for further study because all points are thought to be
essentially equal products of the overall system. On the other
Annual fargef reliability hand, an outlier should be investigated to determine the non-
random, non-common causes that forced this data point to fall
Consequences Gradual failure Sudden.failui-e outside the decision region.
Depending on the shape of the data distribution, other deci-
Very serious 1 OE4 1 OE-7 sion criteria can be established within the boundaries of the
Serious I OE-5 I OE-6 decision points already set. For example, in any symmetrical
Not serious 1 OE-4 IOE-5 distribution, it is expected that 50% of the data will fall either
Serviceability 10E-1 to IOE-2 side of the average line. The possibility of obtaining a long
Source: Zimmerman. T. Chen, Q., and Pandey, M, “Target Reliability string of consecutive values always on one side of the average
Levels for Pipeline Limit States Design,” presented at ASME becomes increasingly remote as the string gets longer. At some
International Pipeline Conference, 1996. point, perhaps after seven or eight consecutive points, it should