
Page 62 - Power Electronic Control in Electrical Systems
P. 62
//SYS21/F:/PEC/REVISES_10-11-01/075065126-CH002.3D ± 52 ± [31±81/51] 17.11.2001 9:49AM
52 Power systems engineering ± fundamental concepts
Fig. 2.19 Three-phase instantaneous and phasor currents.
This suggests that the circuit could be equally well served by the three-phase connec-
tion shown in Figure 2.20, which has only half the number of conductors compared
with Figure 2.18. Figure 2.20 also shows the cross-section of a three-phase cable
capable of carrying the required current. The total cross-section of conductor is 3 A,
that is a saving of 50%.
In the voltage phasor diagram in Figure 20, the voltage across each phase of the
load remains the same as in Figure 2.20, but the voltage between lines is increased:
evidently from the geometry of the triangles
p
V ab V a V b 3Ve j30
p j90
V bc V b V c 3Ve (2:24)
p j150
V ca V c V a 3Ve
where V is the reference phase voltage taken as V a , measured between line A and the
`star point' of the load or the `neutral point' of the supply. Likewise the phase voltage
V b is measured between line B and the star-point of the load, and V c between line C
p
and the star point. The line±line voltages are 3 times the phase voltages. In
Figure 2.20 both the load and the generator are `wye connected' and in terms of
the RMS values only, we have
p
V LL 3V ph and I L I ph (2:25)
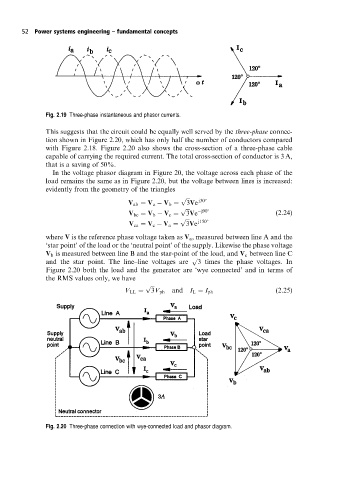
Fig. 2.20 Three-phase connection with wye-connected load and phasor diagram.