
Page 103 - Practical Control Engineering a Guide for Engineers, Managers, and Practitioners
P. 103
78 Cha11ter Four
1
... ·· ..
0.8 . /.\ .: ...
~ .. · ....... : ......... .
0.6 . .
0.4
.,
cu
.a
= 0
0..
~ -0.2
-0.4
..
-0.6 ......... ... ·:· ................. ;
0 •
-0.8 0 • . , .... ••••••••• 0 • '· •• • : •
· ... · 0
•
-1
1880 1900 1920 1940 1960 1980 2000
Tune
1
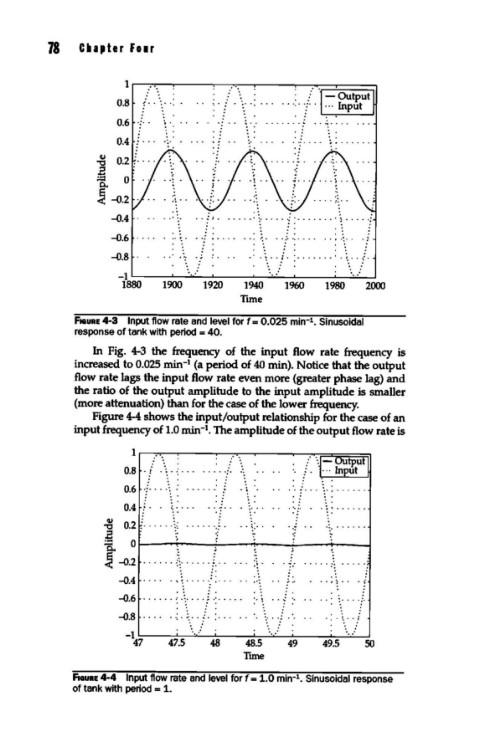
FIGURE 4-3 Input flow rate and level for f = 0.025 min- • Sinusoidal
response of tank with period = 40.
In Fig. 4-3 the frequency of the input flow rate frequency is
1
increased to 0.025 min- (a period of 40 min). Notice that the output
flow rate lags the input flow rate even more (greater phase lag) and
the ratio of the output amplitude to the input amplitude is smaller
(more attenuation) than for the case of the lower frequency.
Figure 4-4 shows the input/output relationship for the case of an
1
input frequency of 1.0 min- • The amplitude of the output flow rate is
1r-~~----~~~----~~~~~~
.-· ••• :· •• 0 .:' • •• - tput
0.8 . / . \ .. : . . . . ... ·/ \ 0 ' .: • : .. In ut
. . :· _:· . . . ~o.· 00~ 0
\ :
0 6 j t .. '\ .0
••••••• ••••••
04 : . . .... . ~ \ ..... .
0:2 .t.:.:. \.:: .... ·:. .. ~:-. . : ·:· .... ..
'
...... -:~- ..... /: .. ·!. . .... :•
-0.4 . . . . . ... ~ . . . . . . . . . . . .-:
-0.6 . . . . . . ....... . .. .: · .
. .
-0.8 ·. :.:.. __ ·_/ .·. · .. : .. .
-17
4 47.5 48 48.5 49 49.5
Tune
1
FIGURE 4-4 Input flow rate and level for f = 1.0 min- • Sinusoidal response
of tank with period = 1.