
Page 108 - Practical Control Engineering a Guide for Engineers, Managers, and Practitioners
P. 108
A New Do11ain and lore Process Models 83
which is derived from Eqs. (4-7) and (4-8). Often control engineers
use decibels or dB instead of magnitude where
dB= 20log (magnitude)
10
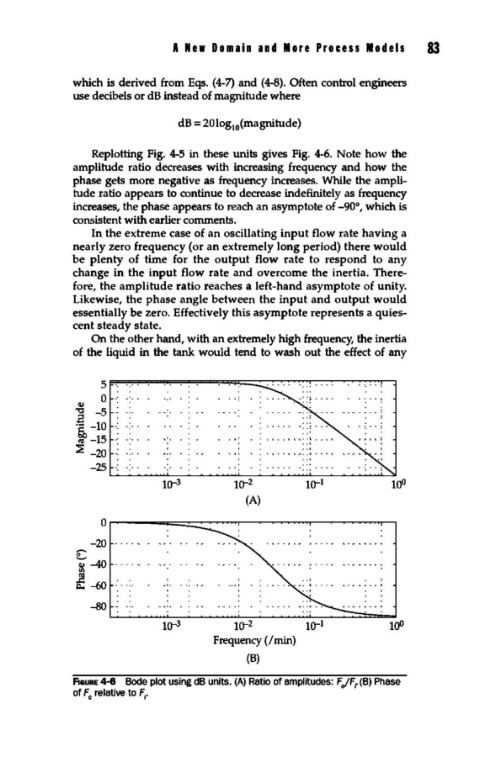
Replotting Fig. 4-5 in these units gives Fig. 4-6. Note how the
amplitude ratio decreases with increasing frequency and how the
phase gets more negative as frequency increases. While the ampli-
tude ratio appears to continue to decrease indefinitely as frequency
increases, the phase appears to reach an asymptote of -90°, which is
consistent with earlier comments.
In the extreme case of an oscillating input flow rate having a
nearly zero frequency (or an extremely long period) there would
be plenty of time for the output flow rate to respond to any
change in the input flow rate and overcome the inertia. There-
fore, the amplitude ratio reaches a left-hand asymptote of unity.
Likewise, the phase angle between the input and output would
essentially be zero. Effectively this asymptote represents a quies-
cent steady state.
On the other hand, with an extremely high frequency, the inertia
of the liquid in the tank would tend to wash out the effect of any
5
0
Q.l
"'0 -5
.a
·~ -10 . ..
!U -15 •'•. ''· • ,: •., •• " a-..••t ......
~ -20
-25
1o-3 1o-2 1Q-1
(A)
Or-----~~~~~~--~~~---~~~~
- -20
0
'i'-40
f-60
--80
1o-3 1o-2 100
Frequency (/min}
(B)
FlauRE 4-8 Bode plot using dB units. (A) Ratio of amplitudes: F JFr (B) Phase
of F relative to F;.
0