
Page 110 - Practical Control Engineering a Guide for Engineers, Managers, and Practitioners
P. 110
A New Do11ain and More Process Models 85
1~2~~--~--~~~~--~~~~--~~
-5 -4 -3 -2 -1 0 1 2 3 4 5
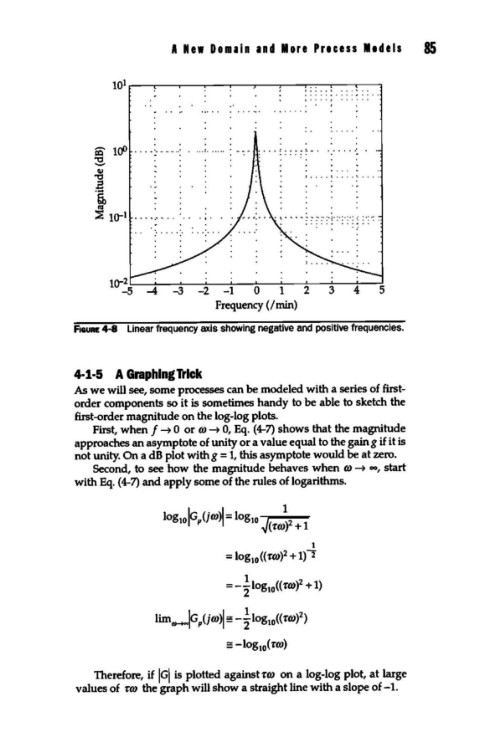
Frequency (I min)
F1auRE 4-8 Linear frequency axis showing negative and positive frequencies.
4·1·5 A Graphing Trick
As we will see, some processes can be modeled with a series of first-
order components so it is sometimes handy to be able to sketch the
first-order magnitude on the log-log plots.
First, when f-+ 0 or ro-+ 0, Eq. (4-7) shows that the magnitude
approaches an asymptote of unity or a value equal to the gain g if it is
not unity. On a dB plot with g = 1, this asymptote would be at zero.
Second, to see how the magnitude behaves when ro -+ oo, start
with Eq. (4-7) and apply some of the rules of logarithms.
1
2
= log 10 (( -rro) + 1) 2
10 2
= -~log ((-rro) + 1)
2
limco-+•IGP(jro)l = -~log10((-rro) )
= -log (-rro)
10
Therefore, if IGI is plotted against -rro on a log-log plot, at large
values of -rro the graph will show a straight line with a slope of -1.