
Page 111 - Practical Control Engineering a Guide for Engineers, Managers, and Practitioners
P. 111
86 Chapter Fonr
Question 4-3 What would the slope at large frequencies be if dB units were used?
Answer For large frequencies dB= 20 log 10 ( TCCJ) so the slope would be -20 dB
per decade change in frequency.
20log10 IG,(jCtl~ = 20 log10 \j( )~ + = 20log10 *
Third, when -rro = 1, the magnitude in dB is given by
1
1
= -20log J2 = -3.0103 dB
10
IG' (jCtl ~ = \j(1)~ + 1 0. 7071
Thus, the graph of IGI is approximately 0.7071 or 3 dB down when
-rro = 1 This frequency, roco, = 1/-r or fcor = 1/(2m) is called the corner
frequency.
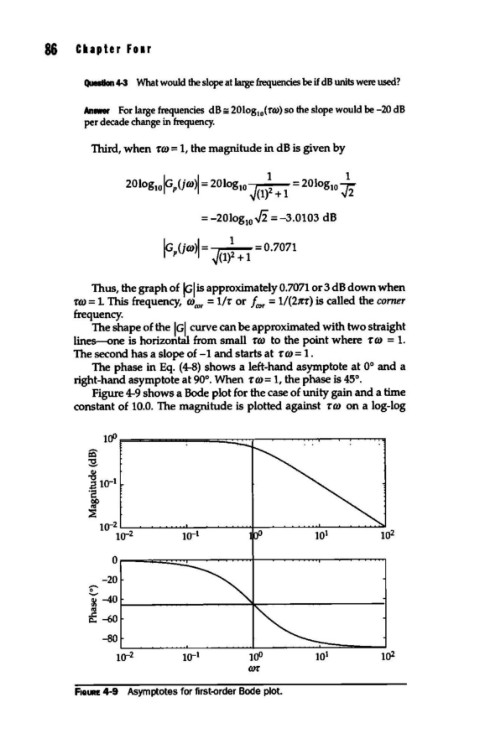
The shape of the IGI curve can be approximated with two straight
lines-one is horizontal from small -rro to the point where t' ro = 1.
The second has a slope of -1 and starts at -r ro = 1 .
The phase in Eq. (4-8) shows a left-hand asymptote at 0° and a
right-hand asymptote at 90°. When -rro= 1, the phase is 45°.
Figure 4-9 shows a Bode plot for the case of unity gain and a time
constant of 10.0. The magnitude is plotted against -rro on a log-log
tOO
CQ
:2..
Ql
] to-•
·c:
~
~
to-2
to-2 to2
0
- -20
0
'i-40
CIS
if --60
-80
to-2 to-• tOO to 1 to2
CC)f
F1auRE 4-9 Asymptotes for first-order Bode plot.