
Page 112 - Practical Control Engineering a Guide for Engineers, Managers, and Practitioners
P. 112
A New Do11ain and More Process Models 87
scale and the phase is plotted on a semilog scale. The vertical line
indicates -reo = 1 and the horizontal line indicates a phase of 45°.
4-2 How Can Sinusoids Help Us with Understanding
Feedback Control?
In the Sec. 4-1, the input flow rate was varied sinusoidally and the
output flow rate was observed. This was an open-loop disturbance
with no control involved. Now, let's dreg up the closed-loop sche-
matic that we talked about in Chap. 3. There is one change, however.
For the time being, the process output will be the process outlet flow
rate, so Eq. (4-1) with its unity gain describes the behavior of our pro-
cess. The process input will still be the process input flow rate.
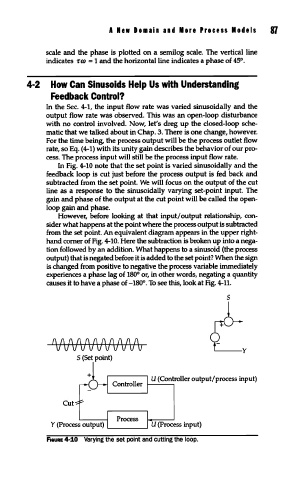
In Fig. 4-10 note that the set point is varied sinusoidally and the
feedback loop is cut just before the process output is fed back and
subtracted from the set point. We will focus on the output of the cut
line as a response to the sinusoidally varying set-point input. The
gain and phase of the output at the cut point will be called the open-
loop gain and phase.
However, before looking at that input/ output relationship, con-
sider what happens at the point where the process output is subtracted
from the set point. An equivalent diagram appears in the upper right-
hand comer of Fig. 4-10. Here the subtraction is broken up into a nega-
tion followed by an addition. What happens to a sinusoid (the process
output) that is negated before it is added to the set point? When the sign
is changed from positive to negative the process variable immediately
experiences a phase lag of 180° or, in other words, negating a quantity
causes it to have a phase of -180°. To see this, look at Fig. 4-11.
s
{\{\f\(\(\{\{\{\(\{\f\
v v1U v-v10 viV v-v-v
S (Set point)
U (Controller output/process input)
Cut
F•auAE 4-10 varying the set point and cutting the loop.