
Page 159 - Practical Control Engineering a Guide for Engineers, Managers, and Practitioners
P. 159
134 Chapter Five
- ~e -i(B3+B2+811) I
3 2 2 2 1 2
- ~(-r ro) + 1~(-r ro) + 1~(-r ro) + 1 m
(5-14)
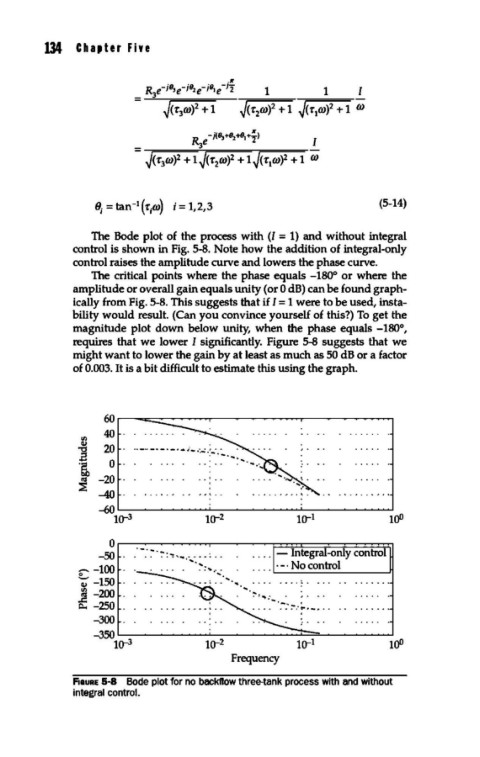
The Bode plot of the process with (I= 1) and without integral
control is shown in Fig. 5-8. Note how the addition of integral-only
control raises the amplitude curve and lowers the phase curve.
The critical points where the phase equals -180° or where the
amplitude or overall gain equals unity (or 0 dB) can be found graph-
ically from Fig. 5-8. This suggests that if I= 1 were to be used, insta-
bility would result. (Can you convince yourself of this?) To get the
magnitude plot down below unity, when the phase equals -180°,
requires that we lower I significantly. Figure 5-8 suggests that we
might want to lower the gain by at least as much as 50 dB or a factor
of 0.003. It is a bit difficult to estimate this using the graph.
40
II)
] 20 ··-·· -· -·- .... i- .·,.: ·:-··:.. ... ,
·~ 0
.. • ..
~ -20
-40
Or-~--~--~~~~--~~t=~~~~~~~
·
-50 ·-:-:-: ,.,. .· .. · ... .. : . . . ... - Integral-only control
--100 ........ · ·- · No control
~ -150
.! -200
c.. -250
-300
-350~~~~~~~--~~~~~~=-~~~~~
1~ 1~ ~ ~
Frequency
F1auRE 5-8 Bode plot for no backflow three-tank process with and without
integral control.