
Page 227 - Practical Design Ships and Floating Structures
P. 227
202
Figure is the time history of axial force of fender located at the center of the structure with gap 4.0cm,
it can be seen that the curve of axial force is a discontinuous line due to the existence of mooring
clearance between the fender and the structure, the long period wave curve with short period wave
curve.
Figure and Fig. is the time history of deflection of the free end and the center in the same case. It
should be noted that the two curves are similar but the phase is different, that is, the structure is not
only moving as a rigid body, but also deflecting as an elastic structure. By analyzing the frequency
characteristic of the curve data using FFT program, we got the distribution of frequency spectrum
# 2
shown in Fig., it should be noted that the frequency of the first peak and second peak are very close to
the yawing period and the first elastic eigen frequency in the horizontal.
(b) Damaged
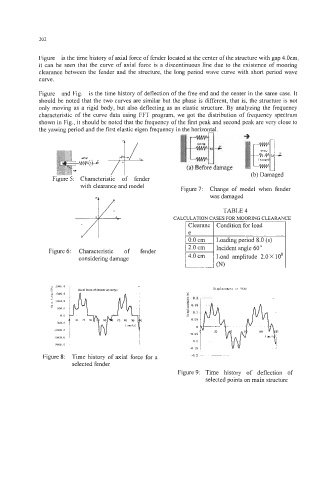
Figure 5: Characteristic of fender
with clearance and model Figure7: Change of model when fender
was damaged
TABLE 4
CALCULATION CASES FOR MOORING CLEARAP r
I Clearanc I Condition for load
le I
Figure 6: Characteristic of fender
considering damage
om of fender al eo - - Displacement of P210
:
:
- 0.15
," 0.1
0
0 0.05
0
-0.05
-0. I
-0.15
Figure 8: Time history of axial force for a
selected fender
Figure 9: Time history of deflection of
selected points on main structure