
Page 363 - Practical Design Ships and Floating Structures
P. 363
338
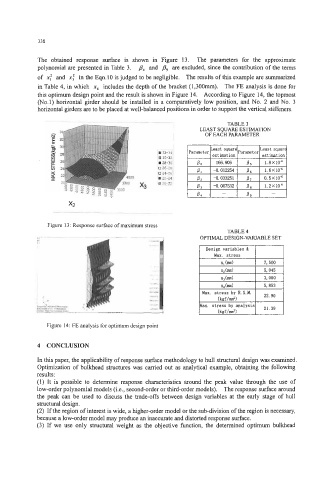
The obtained response surface is shown in Figure 13. The parameters for the approximate
polynomial are presented in Table 3. p4 and p, are excluded, since the contribution of the terms
of x: and x: in the Eqn.10 is judged to be negligible. The results of this example are summarized
in Table 4, in which x4 includes the depth of the bracket (1,300mm). The FE analysis is done for
this optimum design point and the result is shown in Figure 14. According to Figure 14, the topmost
(No.1) horizontal girder should be installed in a comparatively low position, and No. 2 and No. 3
horizontal girders are to be placed at well-balanced positions in order to support the vertical stiffeners.
TABLE 3
I
LEAST SQUARE ESTIMATION
OF EACH PARAMETER
00
x3
Figure 13: Response surface of maximum stress
Design variables &
Max. stress
X, ha) 7,500
x2 (nun) 5,045
x., hull) 3.000
5,853
Figure 14: FE analysis for optimum design point
4 CONCLUSION
In this paper, the applicability of response surface methodology to hull structural design was examined.
Optimization of bulkhead structures was canied out as analytical example, obtaining the following
results:
(1) It is possible to determine response characteristics around the peak value through the use of
low-order polynomial models (i.e., second-order or third-order models). The response surface around
the peak can be used to discuss the trade-offs between design variables at the early stage of hull
structural design.
(2) If the region of interest is wide, a higher-order model or the sub-division of the region is necessary,
because a low-order model may produce an inaccurate and distorted response surface.
(3) If we use only structural weight as the objective function, the determined optimum bulkhead