
Page 256 - Pressure Swing Adsorption
P. 256
':1
232 PRESSURE SWING ADSORPTION PSA PROCESSES 233
l mole Air H.P. Ptoduct
02 21% 0.41 mole
N , 79% o, , 1%
2
N 2 , 99%
N Recovery • 51%.
2
l (a)
Waste Product
0.59 mole
o, : 35% (1) Feed /0 Product
2
N : 65%
2
Figure 6.9 Overall mass balance for PSA nitrogen production process. See Table 6.L
Table 6.1. Performance Characteristics of Nitrotec Nitrogen Generator" (21 N 2 Rinse (5) Air Pressu:nzation
D FHd Air D
Specific energy Efll,_a,- 1.lalm
Product rate 0 1mpuntv N recovery Power (kWh/N mJ o.1r feed
2
2
1
(N nr /h) (%) (%) (kW) product) sloraoe FJ!l
A~~d cS
96 3 84 26 0.27
I
51 1.0 51 23 0.40 N 4 lrom storage
39 0.5 35 20 0.51
21 0.1 15 16 0.76
(3) Vacuum Desorption (4) 0 P(essurization/
2
N2 Product ·cvocuum)
Feed rate: 140 N mJ /h, half-cycle ume 2 mms; adsorbent beds (2): 76 cm diam x 150 cm height
14
(approx); working pressure: 8 atm/1 atm, Data are from Nitrmec brochure, courtesy Nitrotec ~
Corporation, Glen Burnie, MD, and other sources,
LJ
n _ Producl
N 1
highest purity ieveis (> 99.5%) and production rates(> 200 tons/day) does ~ l•H:a.O,COal
the cryogenic system gam a clear economic advantage (see figure 8.10). to storog"
........_______
Cycle Sequence
(b)
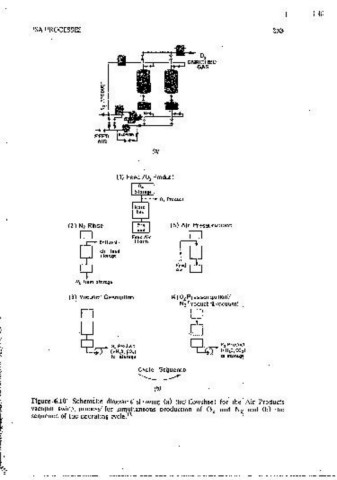
6.4 PSA Process for Simultaneous Production of 0 2
and N Figure 6.10 Schematic diagrams showing (a) the ·flowsheet for the Air Products
2
vacuum swing process· for s1mu1taneous product10n of 02 and N2' and (b) the
Most PSA processes produce one pure product and an impure byproduct, but seauence of the ooeratmg cycle. n
by proper design of the operatmg cycle 1t 1s in fact possible to produce two
reasonably pure products, subject of course to the limitations imposed by the
overall mass balance. An example of such a process 1s the Air Products