Page 277 - Pressure Swing Adsorption
P. 277

',  (  .


            254                                   PRESSURE SWING ADSORPTION                 PSA PROCESSES                                                255
                                                                                             modest  ({3  =  0.5)  and  the  initial  moie  fraction  1s  .large  (Yo= 0.5),  the
                                                                      !000
                                                                                             deviations from  lirtearity, for  both  PA  and  f~ ,  are small.  However,  when  the
                                                                                                                                  3
                                r1-~-                                                        selectivity is  high and the mJtial  mole  fraction  of A  is  small, the curve for  F, 1
                                            --~                                              becomes essentially  linear.  but  the  curve  for  FA  assumes  a highlv  nonlinear
                             I/min                                                           form.  It is clear that, in this situation, by  a sufficiently targe reduction m total
                             0.52   0
                                                                                             pressure almost all  of component  B  can  be desorbed with verv little desorn-
                              t.01   C,                                                      tion of A. A  further deep blowdown or evacuation step then  allows  A  to be
                                                     '~I                                     nonlinearity 1s  actually to enhance the  degree  of seoaration  and  concentra~
                              2.0
                  0.1                                                 100                    removed in concentrated form.
                                   D
                                                                                               This analysis is  for  a  linear eouilibrium system,  but ·the effect of isotherm
                                                              \            2::  0    l       t10n  that can  be  achieved  m  this  type  of process.  Since  the  1soth·erm  for  the
                                                                                             more strongly adsorbed species will  generally have the higher cutvature, even
                                                                           ~
                                                                                             less  of this  comoonent  is  desorbed  dunng  the  imtial  blowdown  compared
                                                                                             with  the eamvaJent  linear equilihriurn  svstem.
                 0.01                                                 10             I.        A  process  of  this  kind  has  rccentlv  been  developed  as  a  means  of
                                                                                             concentrating  and  removing  the  traces  of  tritium  from  the  helium  purge
                                                                                             stream of a  lithium  breeder reactor.-~~  To achieve  a  high  concentration  ratio
                                                                                                  3
                                                                                             ( ~ 10 )  requires a  high select1v1ty ratio (as well as a  high pressure ratio). and
                                                                                             for  H  (or  tritium)  this  can  be  achieved  only  by  qperating  at  cryogenic
                                                                                                  2
                                                 yty                                         temperatures with vacuum ctesorotion at a very low oressure.  Laboratory data
                                  ~                                                          showtng the feasibility of recovering hydrogen at greater than 90% punty and
                                                    "
                                                                                             with  a  similarity high fract10nal  recovery  from  a  stream containing  traces  of
                 0.001
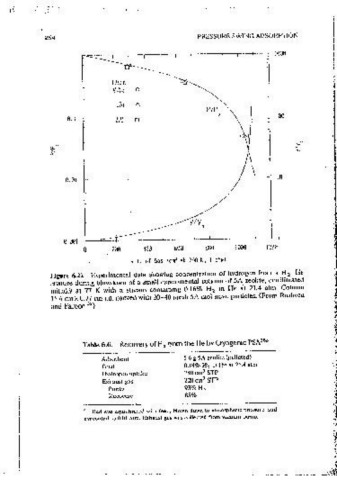
                      0      200     400     600    800     1000    1200                     H  2   m  He  are  summarized  m  Figure  6.22  and  Table  6.6.  The  process
                                                                                             schematic 1s  shown  m  Figure 6.23.
                                  Vol.  of  Gas  lcmJ  at  298  K,  l  atml                                                                37 3
                                                                                               The same principle was used by  Yang and co-workers  · tt  in  recent studies
              Figure  6.22  · Expenmental  data showing  concentration  of hydrogen  from  a /12-He   of the  possibility of removmg and  concentratmg trace  organics  from  air and
              mixture dunng blowctown  of a  small experimental column of 5A zeolite, eqmllbratect   1'   SO from  flue  gas.  It 1s  also  utilized  in  the  Air' Products  fractional  vacuum
                                                                                                2
              initiaflv  at  77  K  with  a  stream  containmg 0.16%  H 2  in  He  at  21.4  atm.  Column   swing adsorption process (FVSA), whicl1  produces 90%  oxygen  together with
              15.6 cTTlx0.77 cm 1.d. packed with 20-40 mesh SA mol sieve particles. (From Ruthven   98-99% nltrogen.  39   The cycle, which 1s  essentially similar to that used  m the
              and Farooq. 36  )   -
                                                                                             hydrogen recovery process, mvolves  four  steps:
                                                                                             •  Actsorot10n  with  feed  air  at  1.1  atm  abs.  with  simurtaneous  withctrawai  of
                                                                                               oxygen product.
                                                                  36
                      Table 6.6.  Recovery of H from the He by Cryogemc PSA  "                 Reverse  flow  blowdown  with  discharge  of  the  blowdown  gas  (impure
                                          2
                          Adsorbent            5.6 g 5A zeolite (pelleted)                     nitrogen) to waste.
                          Feed                 0.J8%H  2  mHeat21.4atm                         Evacuat10n  to  0.1  atm  with  collection  and  recompression  of  the  nitrogen
                           Hydrogen uptake     240cmJ STP                                      product.
                           Exhaust gas         220 cmJ STP                                     Pressunzation with  product oxygen.
                            Puntv              93%H 2
                            Recoverv           85%
                                                                                                With CaX zeolite as  the adsorbent  the seiecnv1ty (a  ~  10) 1s  high enough
                        Bed was equilibrated with  feed,  blown down  to  atmospheric pressure, and   that most of the oxygen  ts  elimmated  m  the  blowdown  step.  About  half the
                      cvacuated to 0.01  atm.  Exhaust gas was collected from vacuum pump.   adsorbed nitrogen can  be  recovered  at 98-99% ounty. dunng the  evacuation
                                                                                             step  which  run  at  about 0.1  atm  abs.  The  schematic  diagram  together with
                                                                                             performance data  are shown  m  Figure 6.24.
   272   273   274   275   276   277   278   279   280   281   282