
Page 166 - Principles of Catalyst Development
P. 166
154 o CHAPTER 7
1l/Jk1P1
>
(al (bl (e)
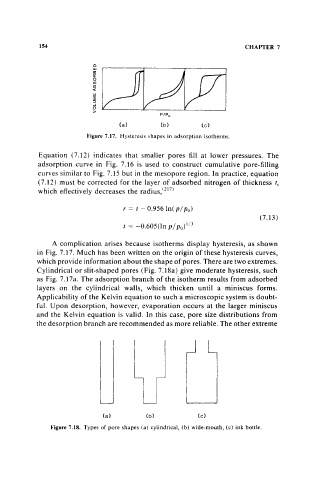
Figure 7.17. Hysteresis shapes in adsorption isotherms.
Equation (7.12) indicates that smaller pores fill at lower pressures. The
adsorption curve in Fig. 7.16 is used to construct cumulative pore-filling
curves similar to Fig. 7.15 but in the mesopore region. In practice, equation
(7.12) must be corrected for the layer of adsorbed nitrogen of thickness t,
which effectively decreases the radius,t217)
r = t - O.956In( pi Po)
(7.13)
A complication arises because isotherms display hysteresis, as shown
in Fig. 7.17. Much has been written on the origin of these hysteresis curves,
which provide information about the shape of pores. There are two extremes.
Cylindrical or slit-shaped pores (Fig. 7.18a) give moderate hysteresis, such
as Fig. 7.17a. The adsorption branch of the isotherm results from adsorbed
layers on the cylindrical walls, which thicken until a miniscus forms.
Applicability of the Kelvin equation to such a microscopic system is doubt-
ful. Upon desorption, however, evaporation occurs at the larger miniscus
and the Kelvin equation is valid. In this case, pore size distributions from
the desorption branch are recommended as more reliable. The other extreme
(a) (b) (el
Figure 7.18. Types of pore shapes (a) cylindrical, (b) wide-mouth, (c) ink bottle.