
Page 165 - Principles of Catalyst Development
P. 165
CATALYST CHARACTERIZATION 153
';"
DISTRIBUTION CURVE
0.4 '"
'" E
0
0.3
~
~
'"
0;- 0.2 .2
..,
'" ....
'" E 0.1 ..,
>
0
ui
:E
:::l
...J PENETRATION CURVE
0
> 0.2
w
II:
0
Q.
w 0.1
>
i=
<C
...J
:::l
:E
:::l 10 3
(J
PORE RADIUS, nm
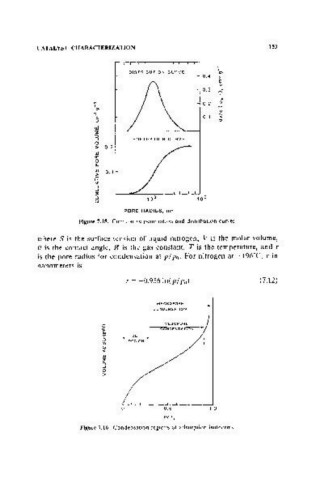
Figure 7.15. Cumulative penetration and distribution curves.
where S is the surface tension of liquid nitrogen, V is the molar volume,
(J is the contact angle, R is the gas constant, T is the temperature, and r
is the pore radius for condensation at P / Po. For nitrogen at -196°C, r in
nanometers is
r = -O.956In(p/ Po) (7.12)
MACROPORE ---+---
CONDENSATION I
I
I I
c I MESOPORE :
w ~NDENSAT~
CD
cr: BET ----..:
o REGION I
rn
c I
« I
w I
::; I
:::l I
...J I
o
>
o 0.5 1.0
P/Po
Figure 7.16. Condensation regions of adsorption isotht~rms.