
Page 160 - Principles of Catalyst Development
P. 160
148 CHAPTER 7
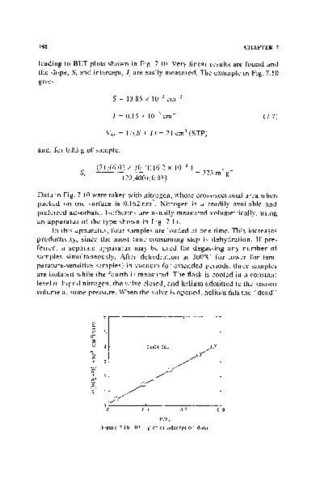
leading to BET plots shown in Fig. 7.10. Very linear results are found and
the slope, 8, and intercept, I, are easily measured. The example in Fig. 7.10
gives
8 = 13.85 x 10 3 cm 3
I = 0.15 X 10- 3 cm- 3 (7.7 )
VM = 1/(8 + I) = 71 cm (STP)
3
and, for 0.83 g of sample,
(71)(6.02 x 10 )(16.2 x 10- °) 2 _I
23
2
s = = 373 m g
g (22,400)( 0.83)
Data in Fig. 7.10 were taken with nitrogen, whose cross-sectional area when
packed on the surface is 0.162 nm • Nitrogen is a readily available and
2
preferred adsorbate. Isotherms are usually measured volumetrically, using
an apparatus of the type shown in Fig. 7.11.
In this apparatus, four samples are loaded at one time. This increases
productivity, since the most time-consuming step is dehydration. If pre-
ferred, a separate apparatus may be used for degassing any number of
samples simultaneously. After dehydration at 300 0 e (or lower for tem-
perature-sensitive samples) in vacuum for extended periods, three samples
are isolated while the fourth is measured. The flask is cooled in a constant
level of liquid nitrogen, the valve closed, and helium admitted to the known
volume at some pressure. When the valve is opened, helium fills the "dead"
: l-,------,-
4 ~
<OJ SILICA GEL
o
>( 3
2
I 2
0. 0
~
il:
0.1 0.2 0.3
PIP o
Figure 7.10. BET plot of adsorption data.