
Page 164 - Principles of Catalyst Development
P. 164
152 CHAPTER 7
TABLE 7.5. Pressure Necessary to Fill Pores
Pressure (aim) Pore radius (nm)
I 6 X 10'
3.5 X 10' 17.5
10' 6
4 X IU' 1.5
Cumulative pore penetration curves are obtained hy measuring the
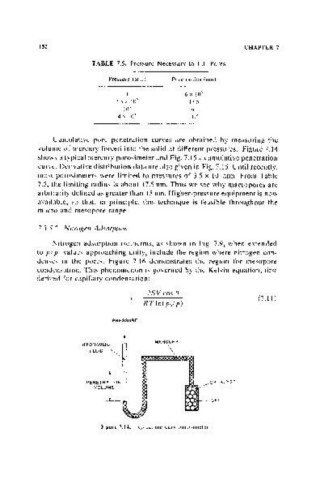
volume of mercury forced into the solid at different pressures. Figure 7.14
shows a typical mercury porosimeter and Fig. 7.15 a cumulative penetration
curve. Derivative distribution data are also given in Fig. 7.15. Until recently,
most porosimeters were limited to pressures of 3.5 x 10 atm. From Table
2
7.5, the limiting radius is about 17.5 nm. Thus we see why macropores are
arbitrarily defined as greater than 15 nm. Higher-pressure equipment is now
available, so that, in principle, this technique is feasible throughout the
macro and meso pore range.
7.3.5.2. Nitrogen Adsorptio/1
Nitrogen adsorption isotherms, as shown in Fig. 7.9, when extended
to p/ PI) values approaching unity, include the region where nitrogen con-
denses in the pores. Figure 7.16 demonstrates the region for mesopore
condensation. This phenomenon is governed by the Kelvin equation, first
derived for capillary condensation:
2SV cos e
r= (7.11)
RT In{po/p)
PRESSURE
MERCURY
HYDRAULIC
FLUID ~ \
r'
PENETRATION
VOLUME
i
~ .- CELL
Figure 7.14. Typical mercury porosimeter.