
Page 250 - Process Equipment and Plant Design Principles and Practices by Subhabrata Ray Gargi Das
P. 250
250 Chapter 9 Phase equilibria
1.0
E
b a
Solute concentration in solution D
c
0.0
– 0 +
Apparent weight of solute
adsorbed / weight of
adsorbent
FIGURE 9.5
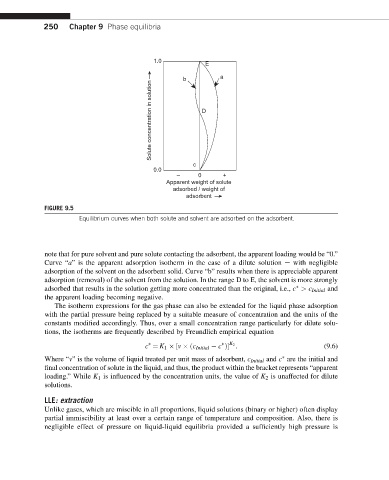
Equilibrium curves when both solute and solvent are adsorbed on the adsorbent.
note that for pure solvent and pure solute contacting the adsorbent, the apparent loading would be “0.”
Curve “a” is the apparent adsorption isotherm in the case of a dilute solution e with negligible
adsorption of the solvent on the adsorbent solid. Curve “b” results when there is appreciable apparent
adsorption (removal) of the solvent from the solution. In the range D to E, the solvent is more strongly
adsorbed that results in the solution getting more concentrated than the original, i.e., c > c Initial and
the apparent loading becoming negative.
The isotherm expressions for the gas phase can also be extended for the liquid phase adsorption
with the partial pressure being replaced by a suitable measure of concentration and the units of the
constants modified accordingly. Thus, over a small concentration range particularly for dilute solu-
tions, the isotherms are frequently described by Freundlich empirical equation
K 2
c ¼ K 1 ½v ðc Initial c Þ . (9.6)
Where “v” is the volume of liquid treated per unit mass of adsorbent, c Initial and c are the initial and
final concentration of solute in the liquid, and thus, the product within the bracket represents “apparent
loading.” While K 1 is influenced by the concentration units, the value of K 2 is unaffected for dilute
solutions.
LLE: extraction
Unlike gases, which are miscible in all proportions, liquid solutions (binary or higher) often display
partial immiscibility at least over a certain range of temperature and composition. Also, there is
negligible effect of pressure on liquid-liquid equilibria provided a sufficiently high pressure is