
Page 249 - Process Equipment and Plant Design Principles and Practices by Subhabrata Ray Gargi Das
P. 249
9.3 Representation of equilibrium 249
Single component liquid adsorption refers to the adsorption of a single adsorbate (solute) from a
solution of inert solvent(s) in which the activity of the solvent(s) is constant. While contacting fresh
adsorbent (solid) with liquid, there is an uptake of adsorbate, as well
as occlusion of liquid into the pores of the solid. This occlusion also
leads to an apparent level of adsorption and must be carefully
Adsorption from a liquid
considered by the designer as this reduces the volume of liquid
recovered after contacting with solid as compared to the volume of
the original contacting liquid in batch processes. The apparent adsorption depends upon the con-
centration of solute, temperature, nature of the solvent and adsorbent. The extent of adsorption
practically always decreases at increased temperature and increased solubility in the solvent.
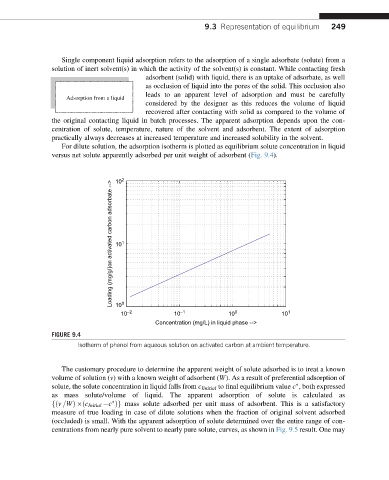
For dilute solution, the adsorption isotherm is plotted as equilibrium solute concentration in liquid
versus net solute apparently adsorbed per unit weight of adsorbent (Fig. 9.4).
2
10
Loading (mg/g/)on activated carbon adsorbate --> 10 1
0
10
10 –2 10 –1 10 0 10 1
Concentration (mg/L) in liquid phase -->
FIGURE 9.4
Isotherm of phenol from aqueous solution on activated carbon at ambient temperature.
The customary procedure to determine the apparent weight of solute adsorbed is to treat a known
volume of solution (v) with a known weight of adsorbent (W). As a result of preferential adsorption of
solute, the solute concentration in liquid falls from c Iinitial to final equilibrium value c , both expressed
as mass solute/volume of liquid. The apparent adsorption of solute is calculated as
fðv =WÞ ðc Initial c Þg mass solute adsorbed per unit mass of adsorbent. This is a satisfactory
measure of true loading in case of dilute solutions when the fraction of original solvent adsorbed
(occluded) is small. With the apparent adsorption of solute determined over the entire range of con-
centrations from nearly pure solvent to nearly pure solute, curves, as shown in Fig. 9.5 result. One may