
Page 251 - Process Equipment and Plant Design Principles and Practices by Subhabrata Ray Gargi Das
P. 251
9.3 Representation of equilibrium 251
maintained to ensure that only the liquid phase is involved. Liquideliquid extraction involves
systems composed of at least three substances (components) and two phases and although the
insoluble phases are chemically very different, all three components generally appear to some extent
in both the phases. In such ternary systems, the equilibria are depicted by triangular diagrams, in
their simple form with equilateral triangular coordinates. The advantage of using a ternary plot for
depicting composition is that the three variables can be conveniently plotted in a two-dimensional
graph. In the triangle, the apices denote pure components and the sides denote compositions of
binary mixtures. This is illustrated in Fig. 9.6A for components A, B and S where the original binary
mixture contains A and B and the partially miscible solvent “S” is added to preferentially extract B.
Apices A, B and S represent pure (100% molar or mass composition) A, B and S respectively and the
scales on the three sides BS, SA and AB are the respective percentages of the binary solutions, e.g., B
in a solution of B and S, S in a solution of S and A, and B in liquid solution of B and A. On addition of
S to a mixture of A and B, the overall composition shifts from side AB to a point M inside the triangle
such that the sum of the perpendiculars from the point to the three opposite sides denote the
respective % of the components in the mixture, and their sum is 100%. The concentration of each
species decreases linearly with distance along the perpendicular line drawn from M to the opposite
side of the triangle. An important property of the diagram is that if lines are drawn from an apex
through the point M and meeting the opposite side, the marking on the axis on the opposite side is the
composition of the two components in the mixture.
(A) B (B) (C)
B
1.0 1.0
0.8 0.2 Extract Solute y = x
curve 0.8 0.8
Raffinate fraction in
curve 0.6 P 0.4 P extract
0.6 0.6
E,R P
0.4 E 0.6 x B , y B 0.4 M E y B 0.4
M R Solute
0.2 R 0.8 0.2 0.2 fraction in
A O Q S 0.0 S 0.0 raffinate
0.8 0.6 0.4 0.2 0.0 0.2 0.4 0.6 0.8 1.0 0.0 0.2 0.4 0.6 0.8 1.0
x S , y S x B
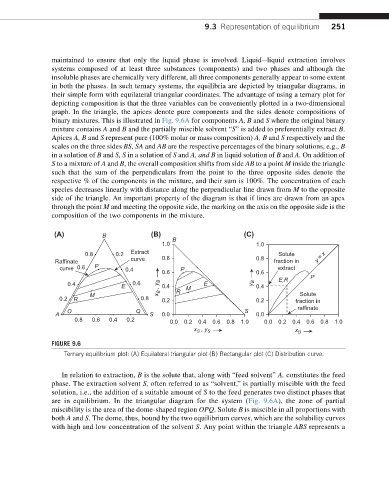
FIGURE 9.6
Ternary equilibrium plot: (A) Equilateral triangular plot (B) Rectangular plot (C) Distribution curve.
In relation to extraction, B is the solute that, along with “feed solvent” A, constitutes the feed
phase. The extraction solvent S, often referred to as “solvent,” is partially miscible with the feed
solution, i.e., the addition of a suitable amount of S to the feed generates two distinct phases that
are in equilibrium. In the triangular diagram for the system (Fig. 9.6A), the zone of partial
miscibility is the area of the dome-shaped region OPQ.Solute B is miscible in all proportions with
both A and S. The dome, thus, bound by the two equilibrium curves, which are the solubility curves
with high and low concentration of the solvent S. Any point within the triangle ABS represents a