
Page 248 - Process Equipment and Plant Design Principles and Practices by Subhabrata Ray Gargi Das
P. 248
248 Chapter 9 Phase equilibria
When one component of a gaseous mixture is appreciably adsorbed over others, the adsorption
isotherm for the pure adsorbate is applicable, with the equilibrium pressure being the partial pressure
of the said vapor. In the case of comparable extent of adsorption of
both components from a binary gaseous mixture, the equilibrium
data are represented as triangular plots, similar to those used in
Multicomponent adsorption
liquid-liquid extraction and elaborated later in this chapter. Unlike
liquid solubility, adsorption is strongly influenced by both tem-
perature and pressure and the equilibrium diagram in these cases
are typically plotted under isothermal-isobaric conditions.
The reference substance method of plotting for gas-liquid solubility is also applicable to adsorption
data where the adsorbate is the reference substance, provided the gas temperature is less than the
critical temperature.
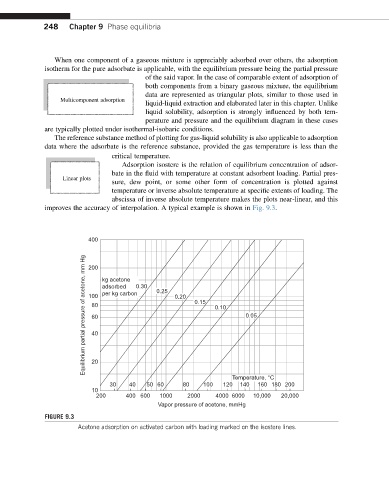
Adsorption isostere is the relation of equilibrium concentration of adsor-
bate in the fluid with temperature at constant adsorbent loading. Partial pres-
Linear plots
sure, dew point, or some other form of concentration is plotted against
temperature or inverse absolute temperature at specific extents of loading. The
abscissa of inverse absolute temperature makes the plots near-linear, and this
improves the accuracy of interpolation. A typical example is shown in Fig. 9.3.
400
Equilibrium partial pressure of acetone, mm Hg 100 kg acetone 0.30 0.25 0.20 0.15 0.10 0.05
200
adsorbed
per kg carbon
80
60
40
20
Temperature, °C
30 40 50 60 80 100 120 140 160 180 200
10
200 400 600 1000 2000 4000 6000 10,000 20,000
Vapor pressure of acetone, mmHg
FIGURE 9.3
Acetone adsorption on activated carbon with loading marked on the isostere lines.