
Page 220 - Process Modelling and Simulation With Finite Element Methods
P. 220
Simulation and Nonlinear Dynamics 207
Time=0.20 Surface: c Contour: si
1 -0 5 0 05 1
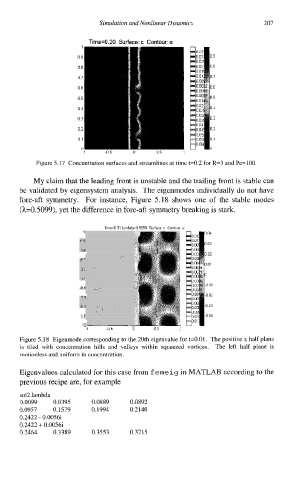
Figure 5.17 Concentration surfaces and streamlines at time t=0.2 for R=3 and Pe=100.
My claim that the leading front is unstable and the trailing front is stable can
be validated by eigensystem analysis. The eigenmodes individually do not have
fore-aft symmetry. For instance, Figure 5.18 shows one of the stable modes
(h=0.5099), yet the difference in fore-aft symmetry breaking is stark.
Time=OOI lambda=06099 Sudace c Contour SI
I 0 04
r4
0 03
38
.., 0 02
r'
0 01
3 I --
0
I,
. 0 01
n 1
0 02
31
LI .', , . 0 03
,
-1 0 04
-. .. .- ....
1 5
Figure 5.18 Eigenmode corresponding to the 20th eigenvalue for t=0.01. The positive x half plane
is tiled with concentration hills and valleys within squeezed vortices. The left half plane is
motionless and uniform in concentration.
Eigenvalues calculated for this case from f emeig in MATLAB according to the
previous recipe are, for example
sol2.lambda
0.0099 0.0395 0.0889 0.0892
0.0957 0.1579 0.1994 0.2140
0.2422 - 0.0056i
0.2422 + 0.0056i
0.2464 0.3389 0.3553 0.3715