
Page 165 - Reliability and Maintainability of In service Pipelines
P. 165
150 Reliability and Maintainability of In-Service Pipelines
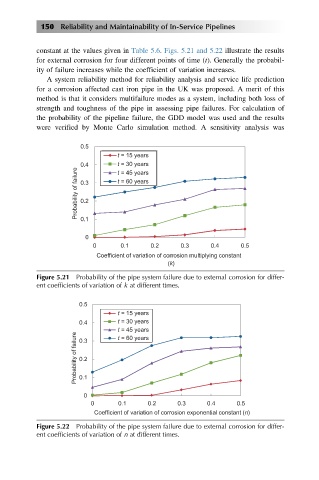
constant at the values given in Table 5.6. Figs. 5.21 and 5.22 illustrate the results
for external corrosion for four different points of time (t). Generally the probabil-
ity of failure increases while the coefficient of variation increases.
A system reliability method for reliability analysis and service life prediction
for a corrosion affected cast iron pipe in the UK was proposed. A merit of this
method is that it considers multifailure modes as a system, including both loss of
strength and toughness of the pipe in assessing pipe failures. For calculation of
the probability of the pipeline failure, the GDD model was used and the results
were verified by Monte Carlo simulation method. A sensitivity analysis was
0.5
t = 15 years
0.4 t = 30 years
Probability of failure 0.3 t = 60 years
t = 45 years
0.2
0.1
0
0 0.1 0.2 0.3 0.4 0.5
Coefficient of variation of corrosion multiplying constant
(k)
Figure 5.21 Probability of the pipe system failure due to external corrosion for differ-
ent coefficients of variation of k at different times.
0.5
t = 15 years
0.4 t = 30 years
t = 45 years
Probability of failure 0.2
t = 60 years
0.3
0.1
0
0 0.1 0.2 0.3 0.4 0.5
Coefficient of variation of corrosion exponential constant (n)
Figure 5.22 Probability of the pipe system failure due to external corrosion for differ-
ent coefficients of variation of n at different times.