
Page 161 - Reliability and Maintainability of In service Pipelines
P. 161
146 Reliability and Maintainability of In-Service Pipelines
0.3 External corrosion
Corrosion rate (mm/year) 0.15 Internal corrosion
0.25
0.2
Power law fit
0.1
0.05
0
0 25 50 75 100 125 150
Average age (year)
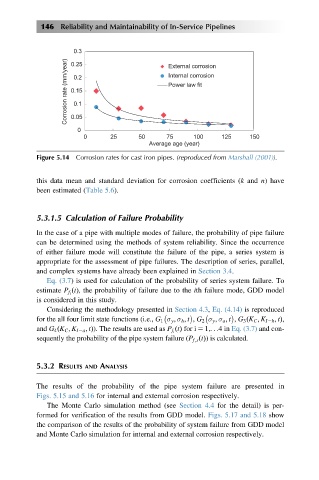
Figure 5.14 Corrosion rates for cast iron pipes. (reproduced from Marshall (2001)).
this data mean and standard deviation for corrosion coefficients (k and n) have
been estimated (Table 5.6).
5.3.1.5 Calculation of Failure Probability
In the case of a pipe with multiple modes of failure, the probability of pipe failure
can be determined using the methods of system reliability. Since the occurrence
of either failure mode will constitute the failure of the pipe, a series system is
appropriate for the assessment of pipe failures. The description of series, parallel,
and complex systems have already been explained in Section 3.4.
Eq. (3.7) is used for calculation of the probability of series system failure. To
ðtÞ, the probability of failure due to the ith failure mode, GDD model
estimate P f i
is considered in this study.
Considering the methodology presented in Section 4.3, Eq. (4.14) is reproduced
for the all four limit state functions (i.e., G 1 σ y ; σ h ; t , G 2 σ y ; σ a ; t , G 3 K C ; K I2h ; tð Þ;
and G 4 K C ; K I2a ; tð Þ). The results are used as P f i t ðÞ for i 5 1,.. .4in Eq. (3.7) and con-
sequently the probability of the pipe system failure (P f;s ðtÞ) is calculated.
5.3.2 RESULTS AND ANALYSIS
The results of the probability of the pipe system failure are presented in
Figs. 5.15 and 5.16 for internal and external corrosion respectively.
The Monte Carlo simulation method (see Section 4.4 for the detail) is per-
formed for verification of the results from GDD model. Figs. 5.17 and 5.18 show
the comparison of the results of the probability of system failure from GDD model
and Monte Carlo simulation for internal and external corrosion respectively.