
Page 164 - Reliability and Maintainability of In service Pipelines
P. 164
Case Studies on the Application of Structural Reliability 149
100
90 t = 15 Years
Relative contribution 70 t = 45 Years
80
t = 30 Years
60
t = 60 Years
50
40
30
20
10
0
p D d Km Cd Bd Ep Kd Ic Ct F Gamma K n
A
Random variable
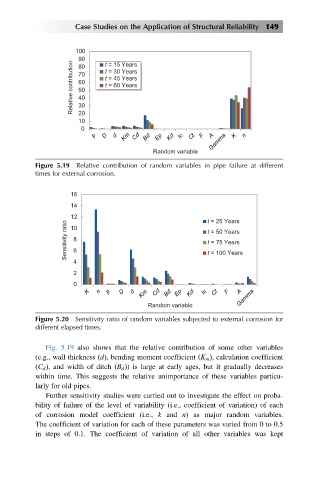
Figure 5.19 Relative contribution of random variables in pipe failure at different
times for external corrosion.
16
14
12 t = 25 Years
Sensitivity ratio 8 t = 50 Years
10
t = 75 Years
6
4 t = 100 Years
2
0
K n p D d Km Cd Bd Ep Kd Ic Ct F A Gamma
Random variable
Figure 5.20 Sensitivity ratio of random variables subjected to external corrosion for
different elapsed times.
Fig. 5.19 also shows that the relative contribution of some other variables
(e.g., wall thickness ðdÞ, bending moment coefficient ðK m Þ, calculation coefficient
ð C d Þ; and width of ditch ðB d Þ) is large at early ages, but it gradually decreases
within time. This suggests the relative unimportance of these variables particu-
larly for old pipes.
Further sensitivity studies were carried out to investigate the effect on proba-
bility of failure of the level of variability (i.e., coefficient of variation) of each
of corrosion model coefficient (i.e., k and n) as major random variables.
The coefficient of variation for each of these parameters was varied from 0 to 0.5
in steps of 0.1. The coefficient of variation of all other variables was kept