Page 162 - Reliability and Maintainability of In service Pipelines
P. 162

Case Studies on the Application of Structural Reliability 147


                       1
                      0.9
                      0.8
                     Probability of failure  0.6
                      0.7

                      0.5
                      0.4
                      0.3
                      0.2
                      0.1
                       0
                         0  100 200 300 400 500 600 700 800 900 1000

                                           Time (year)
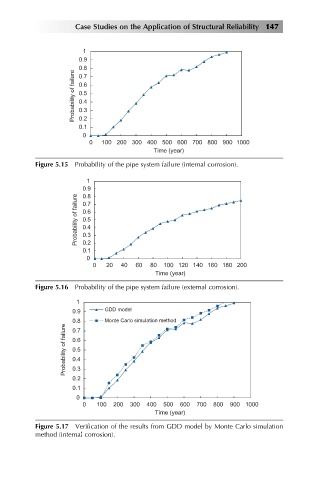
           Figure 5.15 Probability of the pipe system failure (internal corrosion).

                        1
                       0.9
                       0.8
                      Probability of failure  0.6
                       0.7
                       0.5
                       0.4
                       0.3
                       0.2
                       0.1
                        0
                          0   20  40  60  80  100 120 140 160 180 200
                                           Time (year)
           Figure 5.16 Probability of the pipe system failure (external corrosion).
                      1
                     0.9     GDD model
                     0.8     Monte Carlo simulation method
                   Probability of failure  0.6
                     0.7

                     0.5
                     0.4
                     0.3
                     0.2
                     0.1
                      0
                       0   100  200  300  400  500  600  700  800  900 1000
                                           Time (year)

           Figure 5.17 Verification of the results from GDD model by Monte Carlo simulation
           method (internal corrosion).
   157   158   159   160   161   162   163   164   165   166   167