
Page 168 - Reliability and Maintainability of In service Pipelines
P. 168
Case Studies on the Application of Structural Reliability 153
[DS] is dissolved sulfide concentration (mg/L), A is acid-consuming capability or
Alkalinity, b is the width of the stream surface, P is the perimeter of the exposed
wall, and t is time.
To consider uncertainties about wall thickness reduction due to corrosion, a
stochastic model is presented. Considering Equation 1.20, basic random variables
affecting thickness reduction includes: k, u, j,[DS], b/P’, and A.
The wall thickness reduction due to corrosion is a function of basic random
variables as well as time. It can be expressed as:
0
dðtÞ 5 f ðk; u; j; ½DS; b=P ; A; tÞ ð5:29Þ
where k; u; j; ½DS; b=P ; and A are the basic random variables, the probabilistic
0
information of which are presumed available.
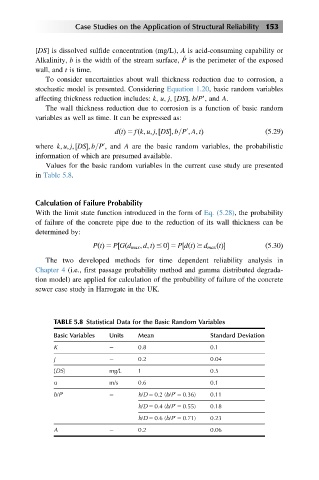
Values for the basic random variables in the current case study are presented
in Table 5.8.
Calculation of Failure Probability
With the limit state function introduced in the form of Eq. (5.28), the probability
of failure of the concrete pipe due to the reduction of its wall thickness can be
determined by:
½
½
PtðÞ 5 PGðd max ; d; tÞ # 0 5 PdðtÞ $ d max ðtÞ ð5:30Þ
The two developed methods for time dependent reliability analysis in
Chapter 4 (i.e., first passage probability method and gamma distributed degrada-
tion model) are applied for calculation of the probability of failure of the concrete
sewer case study in Harrogate in the UK.
TABLE 5.8 Statistical Data for the Basic Random Variables
Basic Variables Units Mean Standard Deviation
K 0.8 0.1
j 0.2 0.04
[DS] mg/L 1 0.5
u m/s 0.6 0.1
b/P’ h/D 5 0.2 (b/P’ 5 0.36) 0.11
h/D 5 0.4 (b/P’ 5 0.55) 0.18
h/D 5 0.6 (b/P’ 5 0.71) 0.23
A 0.2 0.06