
Page 172 - Reliability and Maintainability of In service Pipelines
P. 172
Case Studies on the Application of Structural Reliability 157
1
0.9
0.8
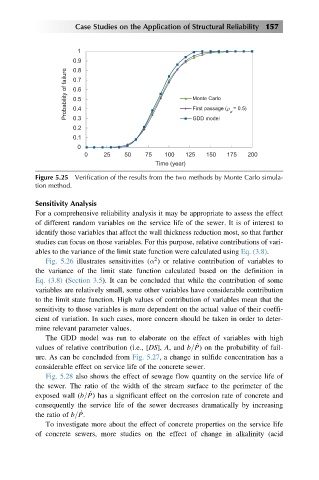
Probability of failure 0.7 Monte Carlo
0.6
0.5
First passage (ρ = 0.5)
0.4
0.3
0.2 GDD model d
0.1
0
0 25 50 75 100 125 150 175 200
Time (year)
Figure 5.25 Verification of the results from the two methods by Monte Carlo simula-
tion method.
Sensitivity Analysis
For a comprehensive reliability analysis it may be appropriate to assess the effect
of different random variables on the service life of the sewer. It is of interest to
identify those variables that affect the wall thickness reduction most, so that further
studies can focus on those variables. For this purpose, relative contributions of vari-
ables to the variance of the limit state function were calculated using Eq. (3.8).
2
Fig. 5.26 illustrates sensitivities (α ) or relative contribution of variables to
the variance of the limit state function calculated based on the definition in
Eq. (3.8) (Section 3.5). It can be concluded that while the contribution of some
variables are relatively small, some other variables have considerable contribution
to the limit state function. High values of contribution of variables mean that the
sensitivity to those variables is more dependent on the actual value of their coeffi-
cient of variation. In such cases, more concern should be taken in order to deter-
mine relevant parameter values.
The GDD model was run to elaborate on the effect of variables with high
values of relative contribution (i.e., [DS], A, and b=P) on the probability of fail-
ure. As can be concluded from Fig. 5.27, a change in sulfide concentration has a
considerable effect on service life of the concrete sewer.
Fig. 5.28 also shows the effect of sewage flow quantity on the service life of
the sewer. The ratio of the width of the stream surface to the perimeter of the
exposed wall (b=P) has a significant effect on the corrosion rate of concrete and
consequently the service life of the sewer decreases dramatically by increasing
the ratio of b=P.
To investigate more about the effect of concrete properties on the service life
of concrete sewers, more studies on the effect of change in alkalinity (acid