
Page 174 - Reliability and Maintainability of In service Pipelines
P. 174
Case Studies on the Application of Structural Reliability 159
1
0.9
0.8 b/P' = 0.36
Probability of failure 0.6 b/P' = 0.55
0.7
0.5
b/P' = 0.71
0.4
0.3
0.2
0.1
0
0 25 50 75 100 125 150 175 200
Time (year)
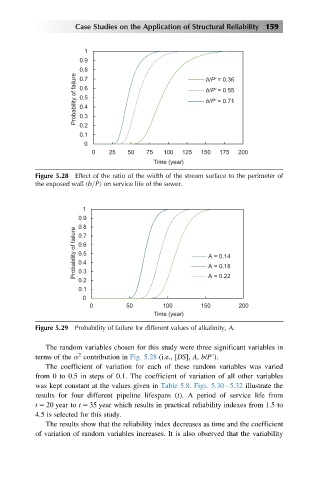
Figure 5.28 Effect of the ratio of the width of the stream surface to the perimeter of
the exposed wall (b=P ) on service life of the sewer.
1
0.9
0.8
Probability of failure 0.7 A = 0.14
0.6
0.5
0.4
A = 0.18
0.3
0.2 A = 0.22
0.1
0
0 50 100 150 200
Time (year)
Figure 5.29 Probability of failure for different values of alkalinity, A.
The random variables chosen for this study were three significant variables in
2
terms of the α contribution in Fig. 5.28 (i.e., [DS], A, b/P’).
The coefficient of variation for each of these random variables was varied
from 0 to 0.5 in steps of 0.1. The coefficient of variation of all other variables
was kept constant at the values given in Table 5.8. Figs. 5.30 5.32 illustrate the
results for four different pipeline lifespans (t). A period of service life from
t 5 20 year to t 5 35 year which results in practical reliability indexes from 1.5 to
4.5 is selected for this study.
The results show that the reliability index decreases as time and the coefficient
of variation of random variables increases. It is also observed that the variability