
Page 173 - Reliability and Maintainability of In service Pipelines
P. 173
158 Reliability and Maintainability of In-Service Pipelines
k u
4% 1%
j
11% [DS]
[DS]
30%
b/P'
A
A j
25% k
u
b/P'
29%
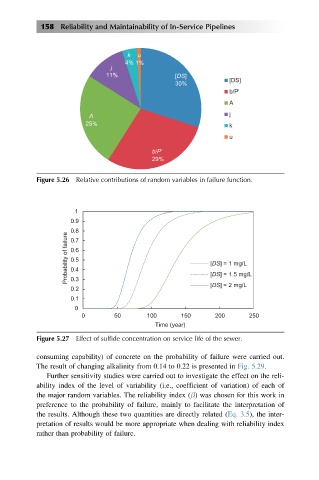
Figure 5.26 Relative contributions of random variables in failure function.
1
0.9
0.8
Probability of failure 0.6 [DS] = 1 mg/L
0.7
0.5
0.4
0.3
[DS] = 2 mg/L
0.2 [DS] = 1.5 mg/L
0.1
0
0 50 100 150 200 250
Time (year)
Figure 5.27 Effect of sulfide concentration on service life of the sewer.
consuming capability) of concrete on the probability of failure were carried out.
The result of changing alkalinity from 0.14 to 0.22 is presented in Fig. 5.29.
Further sensitivity studies were carried out to investigate the effect on the reli-
ability index of the level of variability (i.e., coefficient of variation) of each of
the major random variables. The reliability index (β) was chosen for this work in
preference to the probability of failure, mainly to facilitate the interpretation of
the results. Although these two quantities are directly related (Eq. 3.5), the inter-
pretation of results would be more appropriate when dealing with reliability index
rather than probability of failure.