
Page 175 - Reliability and Maintainability of In service Pipelines
P. 175
5
4.5
4
Reliability index 2.5
3.5
3
2
1.5
1 t = 20 yr t = 25 yr
0.5 t = 30 yr t = 35 yr
0
0 0.1 0.2 0.3 0.4 0.5
Coefficient of variation of [DS]
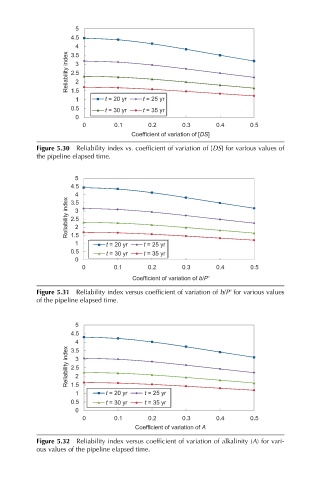
Figure 5.30 Reliability index vs. coefficient of variation of [DS] for various values of
the pipeline elapsed time.
5
4.5
4
Reliability index 2.5
3.5
3
2
1.5
1 t = 20 yr t = 25 yr
0.5 t = 30 yr t = 35 yr
0
0 0.1 0.2 0.3 0.4 0.5
Coefficient of variation of b/P'
Figure 5.31 Reliability index versus coefficient of variation of b/P’ for various values
of the pipeline elapsed time.
5
4.5
4
Reliability index 2.5
3.5
3
2
1.5
1 t = 20 yr t = 25 yr
0.5 t = 30 yr t = 35 yr
0
0 0.1 0.2 0.3 0.4 0.5
Coefficient of variation of A
Figure 5.32 Reliability index versus coefficient of variation of alkalinity (A) for vari-
ous values of the pipeline elapsed time.