
Page 171 - Reliability and Maintainability of In service Pipelines
P. 171
156 Reliability and Maintainability of In-Service Pipelines
1
0.9 ρ = 0.1
Probability of failure 0.7 ρ = 0.5
0.8
d
0.6
d
ρ = 0.9
0.5
d
0.4
0.3
0.2
0.1
0
0 25 50 75 100 125 150 175 200
Time (year)
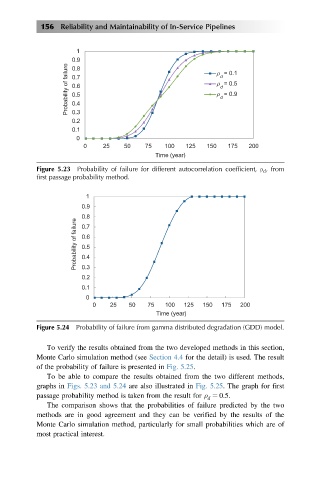
Figure 5.23 Probability of failure for different autocorrelation coefficient, ρ , from
d
first passage probability method.
1
0.9
0.8
Probability of failure 0.6
0.7
0.5
0.4
0.3
0.2
0.1
0
0 25 50 75 100 125 150 175 200
Time (year)
Figure 5.24 Probability of failure from gamma distributed degradation (GDD) model.
To verify the results obtained from the two developed methods in this section,
Monte Carlo simulation method (see Section 4.4 for the detail) is used. The result
of the probability of failure is presented in Fig. 5.25.
To be able to compare the results obtained from the two different methods,
graphs in Figs. 5.23 and 5.24 are also illustrated in Fig. 5.25. The graph for first
passage probability method is taken from the result for ρ 5 0:5.
d
The comparison shows that the probabilities of failure predicted by the two
methods are in good agreement and they can be verified by the results of the
Monte Carlo simulation method, particularly for small probabilities which are of
most practical interest.