
Page 171 - Renewable Energy Devices and System with Simulations in MATLAB and ANSYS
P. 171
158 Renewable Energy Devices and Systems with Simulations in MATLAB and ANSYS ®
®
The coefficient C p has a theoretical maximum value of C p = 16 27 = 0 5926 (Betz limit). In
.
/
practice, the efficiency of a rotor is not as high as the ideal value, but more typical efficiencies range
from 35% to 45%. Since (7.2) defines the instantaneous power and the characterization of a wind
turbine, the associated generator must be sized in accordance with a random nature; it is very appro-
priate to define the local wind power as proportional to the statistical distribution of speed instead
of instantaneous values [4].
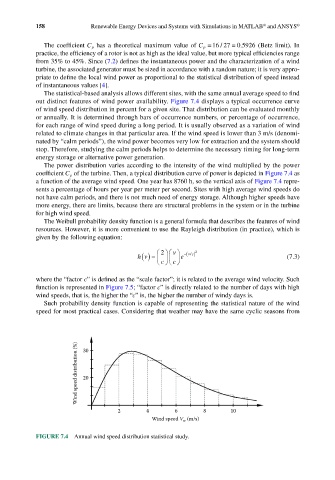
The statistical-based analysis allows different sites, with the same annual average speed to find
out distinct features of wind power availability. Figure 7.4 displays a typical occurrence curve
of wind speed distribution in percent for a given site. That distribution can be evaluated monthly
or annually. It is determined through bars of occurrence numbers, or percentage of occurrence,
for each range of wind speed during a long period. It is usually observed as a variation of wind
related to climate changes in that particular area. If the wind speed is lower than 3 m/s (denomi-
nated by “calm periods”), the wind power becomes very low for extraction and the system should
stop. Therefore, studying the calm periods helps to determine the necessary timing for long-term
energy storage or alternative power generation.
The power distribution varies according to the intensity of the wind multiplied by the power
coefficient C p of the turbine. Then, a typical distribution curve of power is depicted in Figure 7.4 as
a function of the average wind speed. One year has 8760 h, so the vertical axis of Figure 7.4 repre-
sents a percentage of hours per year per meter per second. Sites with high average wind speeds do
not have calm periods, and there is not much need of energy storage. Although higher speeds have
more energy, there are limits, because there are structural problems in the system or in the turbine
for high wind speed.
The Weibull probability density function is a general formula that describes the features of wind
resources. However, it is more convenient to use the Rayleigh distribution (in practice), which is
given by the following equation:
v −( / 2
2
vc)
h v () = e (7.3)
c
c
where the “factor c” is defined as the “scale factor”; it is related to the average wind velocity. Such
function is represented in Figure 7.5; “factor c” is directly related to the number of days with high
wind speeds, that is, the higher the “c” is, the higher the number of windy days is.
Such probability density function is capable of representing the statistical nature of the wind
speed for most practical cases. Considering that weather may have the same cyclic seasons from
Wind speed distribution (%) 30
20
2 4 6 8 10
Wind speed V (m/s)
w
FIGURE 7.4 Annual wind speed distribution statistical study.