
Page 308 - Renewable Energy Devices and System with Simulations in MATLAB and ANSYS
P. 308
Power Conversion and Control for Fuel Cell Systems in Transportation 295
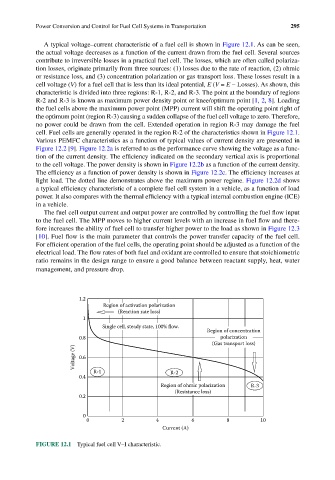
A typical voltage–current characteristic of a fuel cell is shown in Figure 12.1. As can be seen,
the actual voltage decreases as a function of the current drawn from the fuel cell. Several sources
contribute to irreversible losses in a practical fuel cell. The losses, which are often called polariza-
tion losses, originate primarily from three sources: (1) losses due to the rate of reaction, (2) ohmic
or resistance loss, and (3) concentration polarization or gas transport loss. These losses result in a
cell voltage (V) for a fuel cell that is less than its ideal potential, E (V = E − Losses). As shown, this
characteristic is divided into three regions: R-1, R-2, and R-3. The point at the boundary of regions
R-2 and R-3 is known as maximum power density point or knee/optimum point [1, 2, 8]. Loading
the fuel cells above the maximum power point (MPP) current will shift the operating point right of
the optimum point (region R-3) causing a sudden collapse of the fuel cell voltage to zero. Therefore,
no power could be drawn from the cell. Extended operation in region R-3 may damage the fuel
cell. Fuel cells are generally operated in the region R-2 of the characteristics shown in Figure 12.1.
Various PEMFC characteristics as a function of typical values of current density are presented in
Figure 12.2 [9]. Figure 12.2a is referred to as the performance curve showing the voltage as a func-
tion of the current density. The efficiency indicated on the secondary vertical axis is proportional
to the cell voltage. The power density is shown in Figure 12.2b as a function of the current density.
The efficiency as a function of power density is shown in Figure 12.2c. The efficiency increases at
light load. The dotted line demonstrates above the maximum power regime. Figure 12.2d shows
a typical efficiency characteristic of a complete fuel cell system in a vehicle, as a function of load
power. It also compares with the thermal efficiency with a typical internal combustion engine (ICE)
in a vehicle.
The fuel cell output current and output power are controlled by controlling the fuel flow input
to the fuel cell. The MPP moves to higher current levels with an increase in fuel flow and there-
fore increases the ability of fuel cell to transfer higher power to the load as shown in Figure 12.3
[10]. Fuel flow is the main parameter that controls the power transfer capacity of the fuel cell.
For efficient operation of the fuel cells, the operating point should be adjusted as a function of the
electrical load. The flow rates of both fuel and oxidant are controlled to ensure that stoichiometric
ratio remains in the design range to ensure a good balance between reactant supply, heat, water
management, and pressure drop.
1.2
Region of activation polarization
(Reaction rate loss)
1
Single cell, steady state, 100% flow.
Region of concentration
0.8 polarization
(Gas transport loss)
Voltage (V) 0.6
0.4 R-1 R-2
Region of ohmic polarization R-3
(Resistance loss)
0.2
0
0 2 4 6 8 10
Current (A)
FIGURE 12.1 Typical fuel cell V–I characteristic.