
Page 344 - Renewable Energy Devices and System with Simulations in MATLAB and ANSYS
P. 344
Batteries and Ultracapacitors for Electric Power Systems with Renewable Energy Sources 331
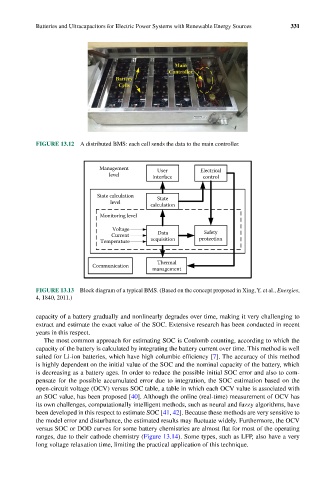
FIGURE 13.12 A distributed BMS: each cell sends the data to the main controller.
Management User Electrical
level interface control
State calculation State
level calculation
Monitoring level
Voltage Safety
Current Data
Temperature acquisition protection
Thermal
Communication
management
FIGURE 13.13 Block diagram of a typical BMS. (Based on the concept proposed in Xing, Y. et al., Energies,
4, 1840, 2011.)
capacity of a battery gradually and nonlinearly degrades over time, making it very challenging to
extract and estimate the exact value of the SOC. Extensive research has been conducted in recent
years in this respect.
The most common approach for estimating SOC is Coulomb counting, according to which the
capacity of the battery is calculated by integrating the battery current over time. This method is well
suited for Li-ion batteries, which have high columbic efficiency [7]. The accuracy of this method
is highly dependent on the initial value of the SOC and the nominal capacity of the battery, which
is decreasing as a battery ages. In order to reduce the possible initial SOC error and also to com-
pensate for the possible accumulated error due to integration, the SOC estimation based on the
open-circuit voltage (OCV) versus SOC table, a table in which each OCV value is associated with
an SOC value, has been proposed [40]. Although the online (real-time) measurement of OCV has
its own challenges, computationally intelligent methods, such as neural and fuzzy algorithms, have
been developed in this respect to estimate SOC [41, 42]. Because these methods are very sensitive to
the model error and disturbance, the estimated results may fluctuate widely. Furthermore, the OCV
versus SOC or DOD curves for some battery chemistries are almost flat for most of the operating
ranges, due to their cathode chemistry (Figure 13.14). Some types, such as LFP, also have a very
long voltage relaxation time, limiting the practical application of this technique.