
Page 377 - Renewable Energy Devices and System with Simulations in MATLAB and ANSYS
P. 377
364 Renewable Energy Devices and Systems with Simulations in MATLAB and ANSYS ®
®
1 1 1 1 1 1
MTBF = + + + + − ∑
1 λ + λ 6 2 λ + λ 6 3 λ + λ 6 4 λ + λ 6 5 λ + λ 6 0 ij λ i + λ j + λ 6
<< <6
+ ∑ 1 − ∑ 1 + 1
+
2
0 0<< << 6 i λ + λ j + λ k + 6 λ 0<< << < 6 i λ + λ j + λ k + λ l + 6 λ λ 1 + λ + λ 3 + λ 4 + λ 5 + λ 6
k
ij
kl
ij
(14.15)
The failure rate is the reciprocal of the MTBF. So, the failure rate expression is obtained as
follows:
λ = MTBF −1
= 1 + 1 + 1 + 1 + 1 − ∑ 1
λ + λ 6 λ + λ 6 λ + λ 6 λ + λ 6 λ + λ 6 λ + λ j + λ 6
+
i
5
2
3
4
1
0 << <6ij − 1
+ ∑ 1 − ∑ 1 + 1
0 ij k λ i + λ j + λ k + λ 6 0 ij kl λ i + λ j + λ k + λ l + λ 6 6 λ 1 + λ 2 + λ 3 + λ 4 + λ 5 + λ 6
<< << <6
<< <<6
(14.16)
The economy characteristic of Super UPS is represented by the converter cost which is domi-
nated by the number of converters.
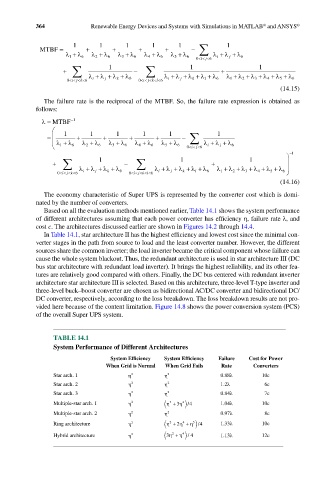
Based on all the evaluation methods mentioned earlier, Table 14.1 shows the system performance
of different architectures assuming that each power converter has efficiency η, failure rate λ, and
cost c. The architectures discussed earlier are shown in Figures 14.2 through 14.4.
In Table 14.1, star architecture II has the highest efficiency and lowest cost since the minimal con-
verter stages in the path from source to load and the least converter number. However, the different
sources share the common inverter; the load inverter became the critical component whose failure can
cause the whole system blackout. Thus, the redundant architecture is used in star architecture III (DC
bus star architecture with redundant load inverter). It brings the highest reliability, and its other fea-
tures are relatively good compared with others. Finally, the DC bus centered with redundant inverter
architecture star architecture III is selected. Based on this architecture, three-level T-type inverter and
three-level buck–boost converter are chosen as bidirectional AC/DC converter and bidirectional DC/
DC converter, respectively, according to the loss breakdown. The loss breakdown results are not pro-
vided here because of the content limitation. Figure 14.8 shows the power conversion system (PCS)
of the overall Super UPS system.
TABLE 14.1
System Performance of Different Architectures
System Efficiency System Efficiency Failure Cost for Power
When Grid is Normal When Grid Fails Rate Converters
Star arch. 1 η 2 η 2 0.88λ 10c
Star arch. 2 η 2 η 2 1.2λ 6c
Star arch. 3 η 2 η 2 0.84λ 7c
4
Multiple-star arch. 1 η 2 ( η + ) / 4 1.04λ 10c
2
η
3
Multiple-star arch. 2 η 2 η 2 0.97λ 8c
5
4
2
η
Ring architecture η 2 ( η + 2 η + ) / 4 1.33λ 10c
2
4
η
Hybrid architecture η 2 ( 3η + ) / 4 1.13λ 12c