
Page 72 - Renewable Energy Devices and System with Simulations in MATLAB and ANSYS
P. 72
Overview of Single-Phase Grid-Connected Photovoltaic Systems 59
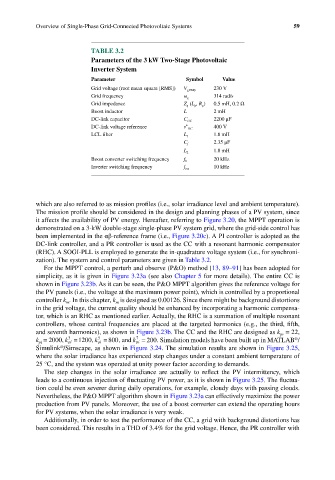
TABLE 3.2
Parameters of the 3 kW Two-Stage Photovoltaic
Inverter System
Parameter Symbol Value
Grid voltage (root mean square [RMS]) V gRMS 230 V
Grid frequency ω g 314 rad/s
Grid impedance Z g (L g , R g ) 0.5 mH, 0.2 Ω
Boost inductor L 2 mH
DC-link capacitor C DC 2200 μF
DC-link voltage reference v DC 400 V
*
LCL filter L 1 1.8 mH
C f 2.35 μF
L 2 1.8 mH
Boost converter switching frequency f b 20 kHz
Inverter switching frequency f inv 10 kHz
which are also referred to as mission profiles (i.e., solar irradiance level and ambient temperature).
The mission profile should be considered in the design and planning phases of a PV system, since
it affects the availability of PV energy. Hereafter, referring to Figure 3.20, the MPPT operation is
demonstrated on a 3-kW double-stage single-phase PV system grid, where the grid-side control has
been implemented in the αβ-reference frame (i.e., Figure 3.20c). A PI controller is adopted as the
DC-link controller, and a PR controller is used as the CC with a resonant harmonic compensator
(RHC). A SOGI-PLL is employed to generate the in-quadrature voltage system (i.e., for synchroni-
zation). The system and control parameters are given in Table 3.2.
For the MPPT control, a perturb and observe (P&O) method [13, 89–91] has been adopted for
simplicity, as it is given in Figure 3.23a (see also Chapter 5 for more details). The entire CC is
shown in Figure 3.23b. As it can be seen, the P&O MPPT algorithm gives the reference voltage for
the PV panels (i.e., the voltage at the maximum power point), which is controlled by a proportional
controller k . In this chapter, k is designed as 0.00126. Since there might be background distortions
m
m
in the grid voltage, the current quality should be enhanced by incorporating a harmonic compensa-
tor, which is an RHC as mentioned earlier. Actually, the RHC is a summation of multiple resonant
controllers, whose central frequencies are placed at the targeted harmonics (e.g., the third, fifth,
and seventh harmonics), as shown in Figure 3.23b. The CC and the RHC are designed as k = 22,
pr
k = 2000, k pi = 1200, k pi = 800, and k pi = 200. Simulation models have been built up in MATLAB /
3
5
7
®
pi
Simulink /Simscape, as shown in Figure 3.24. The simulation results are shown in Figure 3.25,
®
where the solar irradiance has experienced step changes under a constant ambient temperature of
25 °C, and the system was operated at unity power factor according to demands.
The step changes in the solar irradiance are actually to reflect the PV intermittency, which
leads to a continuous injection of fluctuating PV power, as it is shown in Figure 3.25. The fluctua-
tion could be even severer during daily operations, for example, cloudy days with passing clouds.
Nevertheless, the P&O MPPT algorithm shown in Figure 3.23a can effectively maximize the power
production from PV panels. Moreover, the use of a boost converter can extend the operating hours
for PV systems, when the solar irradiance is very weak.
Additionally, in order to test the performance of the CC, a grid with background distortions has
been considered. This results in a THD of 3.4% for the grid voltage. Hence, the PR controller with