
Page 41 - Reservoir Formation Damage
P. 41
Mineralogy and Mineral Sensitivity of Petroleum-Bearing Formations 25
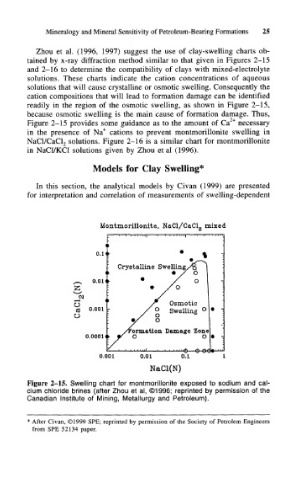
Zhou et al. (1996, 1997) suggest the use of clay-swelling charts ob-
tained by x-ray diffraction method similar to that given in Figures 2-15
and 2-16 to determine the compatibility of clays with mixed-electrolyte
solutions. These charts indicate the cation concentrations of aqueous
solutions that will cause crystalline or osmotic swelling. Consequently the
cation compositions that will lead to formation damage can be identified
readily in the region of the osmotic swelling, as shown in Figure 2-15,
because osmotic swelling is the main cause of formation damage. Thus,
Figure 2-15 provides some guidance as to the amount of Ca 2+ necessary
in the presence of Na + cations to prevent montmorillonite swelling in
solutions. Figure 2-16 is a similar chart for montmorillonite
NaCl/CaCl 2
in NaCl/KCl solutions given by Zhou et al (1996).
Models for Clay Swelling*
In this section, the analytical models by Civan (1999) are presented
for interpretation and correlation of measurements of swelling-dependent
Montmorillonite, NaCl/CaCl 2 mixed
Osmotic
0 Swelling °
O
O
ormation Damage Zone
0.001 0.01 0.1
NaCl(N)
Figure 2-15. Swelling chart for montmorillonite exposed to sodium and cal-
cium chloride brines (after Zhou et al, ©1996; reprinted by permission of the
Canadian Institute of Mining, Metallurgy and Petroleum).
* After Civan, ©1999 SPE; reprinted by permission of the Society of Petrolem Engineers
from SPE 52134 paper.