
Page 287 - Rock Mechanics For Underground Mining
P. 287
STOPE WALL DESIGN – THE MATHEWS STABILITY CHART METHOD
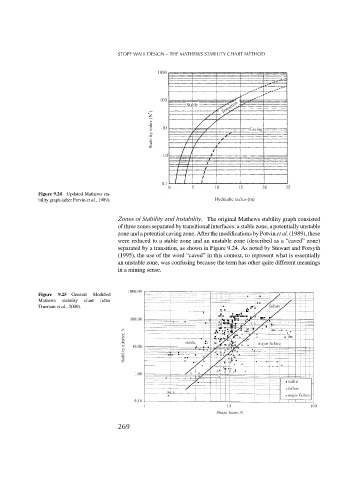
Figure 9.24 Updated Mathews sta-
bility graph (after Potvin et al., 1989).
Zones of Stability and Instability. The original Mathews stability graph consisted
of three zones separated by transitional interfaces: a stable zone, a potentially unstable
zone and a potential caving zone. After the modifications by Potvin et al. (1989), these
were reduced to a stable zone and an unstable zone (described as a “caved” zone)
separated by a transition, as shown in Figure 9.24. As noted by Stewart and Forsyth
(1995), the use of the word “caved” in this context, to represent what is essentially
an unstable zone, was confusing because the term has other quite different meanings
in a mining sense.
Figure 9.25 General Modified
Mathews stability chart (after
Trueman et al., 2000).
269