
Page 288 - Rock Mechanics For Underground Mining
P. 288
EXCAVATION DESIGN IN BLOCKY ROCK
The alternative presentation of the stability chart, due to Trueman et al. (2000) is an
attempt to provide more discriminating boundaries between zones of stability, local
failure and major failure of stope walls.
For any particular design or stability analysis problem, application of the Mathews
method and its more recent versions is quite straightforward, involving the sequential
calculation of the various factors and assessment of the prospective stope wall stabil-
ity from the chosen stability chart. Although the approach may appear rigorous, in
practice the user needs to be mindful of the limitations arising from uncertainties in
the original data set.
Problem
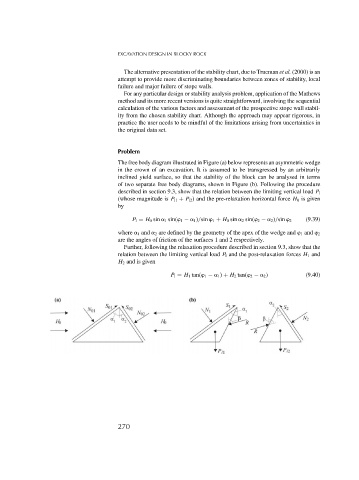
The free body diagram illustrated in Figure (a) below represents an asymmetric wedge
in the crown of an excavation. It is assumed to be transgressed by an arbitrarily
inclined yield surface, so that the stability of the block can be analysed in terms
of two separate free body diagrams, shown in Figure (b). Following the procedure
described in section 9.3, show that the relation between the limiting vertical load P l
(whose magnitude is P l1 + P l2 ) and the pre-relaxation horizontal force H 0 is given
by
P l = H 0 sin 1 sin( 1 − 1 )/sin 1 + H 0 sin 2 sin( 2 − 2 )/sin 2 (9.39)
where 1 and 2 are defined by the geometry of the apex of the wedge and 1 and 2
are the angles of friction of the surfaces 1 and 2 respectively.
Further, following the relaxation procedure described in section 9.3, show that the
relation between the limiting vertical load P l and the post-relaxation forces H 1 and
H 2 and is given
P l = H 1 tan( 1 − 1 ) + H 2 tan( 2 − 2 ) (9.40)
270